Macy's 2014 Annual Report Download - page 85
Download and view the complete annual report
Please find page 85 of the 2014 Macy's annual report below. You can navigate through the pages in the report by either clicking on the pages listed below, or by using the keyword search tool below to find specific information within the annual report.-
 1
1 -
2
-
3
-
4
-
5
-
6
-
7
-
8
-
9
-
10
-
11
-
12
-
13
-
14
-
15
-
16
-
17
-
18
-
19
-
20
-
21
-
22
-
23
-
24
-
25
-
26
-
27
-
28
-
29
-
30
-
31
-
32
-
33
-
34
-
35
-
36
-
37
-
38
-
39
-
40
-
41
-
42
-
43
-
44
-
45
-
46
-
47
-
48
-
49
-
50
-
51
-
52
-
53
-
54
-
55
-
56
-
57
-
58
-
59
-
60
-
61
-
62
-
63
-
64
-
65
-
66
-
67
-
68
-
69
-
70
-
71
-
72
-
73
-
74
-
 75
75 -
 76
76 -
 77
77 -
 78
78 -
 79
79 -
 80
80 -
 81
81 -
 82
82 -
 83
83 -
 84
84 -
 85
85 -
 86
86 -
 87
87 -
 88
88 -
 89
89 -
 90
90 -
 91
91 -
 92
92 -
 93
93 -
 94
94 -
 95
95 -
96
-
97
-
98
-
99
-
100
-
101
-
102
-
103
-
104
 |
 |

NOTES TO CONSOLIDATED FINANCIAL STATEMENTS — (Continued)
F-38
Also during 2014, 2013 and 2012, the CMD Committee approved awards of time-based restricted stock units to
certain senior executives of the Company and awards of time-based restricted stock units to the non-employee members of
the Company’s board of directors.
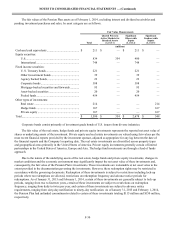
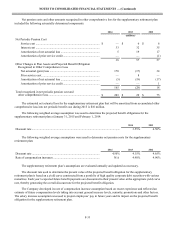
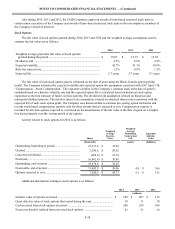
Stock Options
The fair value of stock options granted during 2014, 2013 and 2012 and the weighted average assumptions used to
estimate the fair value are as follows:
2014 2013 2012
Weighted average grant date fair value of stock options
granted during the period...................................................................... $ 19.07 $ 12.15 $ 12.22
Dividend yield.......................................................................................... 2.5% 2.8% 2.2%
Expected volatility.................................................................................... 42.7% 41.3% 39.8%
Risk-free interest rate ............................................................................... 1.5% 0.8% 1.2%
Expected life............................................................................................. 5.7 years 5.7 years 5.7 years
The fair value of each stock option grant is estimated on the date of grant using the Black-Scholes option-pricing
model. The Company estimates the expected volatility and expected option life assumption consistent with ASC Topic 718,
“Compensation – Stock Compensation.” The expected volatility of the Company’s common stock at the date of grant is
estimated based on a historic volatility rate and the expected option life is calculated based on historical stock option
experience as the best estimate of future exercise patterns. The dividend yield assumption is based on historical and
anticipated dividend payouts. The risk-free interest rate assumption is based on observed interest rates consistent with the
expected life of each stock option grant. The Company uses historical data to estimate pre-vesting option forfeitures and
records stock-based compensation expense only for those awards that are expected to vest. Compensation expense is
recorded for all stock options expected to vest based on the amortization of the fair value at the date of grant on a straight-
line basis primarily over the vesting period of the options.
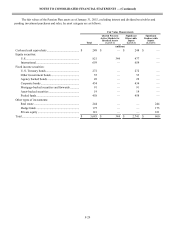
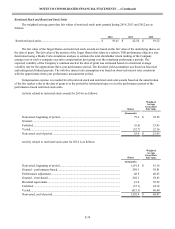
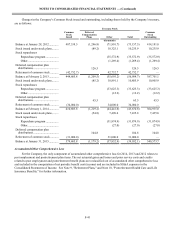
Activity related to stock options for 2014 is as follows:
Shares
Weighted
Average
Exercise
Price
Weighted
Average
Remaining
Contractual
Life
Aggregate
Intrinsic
Value
(thousands) (years) (millions)
Outstanding, beginning of period ................................. 23,313.6 $ 32.02
Granted ......................................................................... 3,296.0 $ 58.92
Canceled or forfeited .................................................... (468.4) $ 41.10
Exercised....................................................................... (6,462.4) $ 30.98
Outstanding, end of period ........................................... 19,678.8 $ 36.65
Exercisable, end of period ............................................ 11,405.5 $ 30.06 4.0 $ 386
Options expected to vest............................................... 7,280.5 $ 45.73 8.1 $ 132
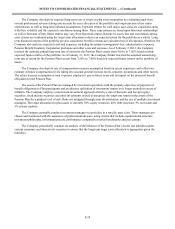
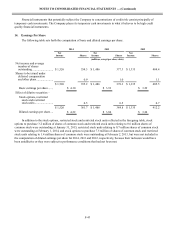
Additional information relating to stock options is as follows:
2014 2013 2012
(millions)
Intrinsic value of options exercised............................................................................ $ 189 $ 207 $ 132
Grant date fair value of stock options that vested during the year............................. 38 31 30
Cash received from stock options exercised .............................................................. 200 254 164
Excess tax benefits realized from exercised stock options ........................................ 43 51 36