Macy's 2014 Annual Report Download - page 18
Download and view the complete annual report
Please find page 18 of the 2014 Macy's annual report below. You can navigate through the pages in the report by either clicking on the pages listed below, or by using the keyword search tool below to find specific information within the annual report.-
 1
1 -
2
-
3
-
4
-
5
-
6
-
7
-
 8
8 -
 9
9 -
 10
10 -
 11
11 -
 12
12 -
 13
13 -
 14
14 -
 15
15 -
 16
16 -
 17
17 -
 18
18 -
 19
19 -
 20
20 -
 21
21 -
 22
22 -
 23
23 -
 24
24 -
 25
25 -
 26
26 -
 27
27 -
 28
28 -
29
-
30
-
31
-
32
-
33
-
34
-
35
-
36
-
37
-
38
-
39
-
40
-
41
-
42
-
43
-
44
-
45
-
46
-
47
-
48
-
49
-
50
-
51
-
52
-
53
-
54
-
55
-
56
-
57
-
58
-
59
-
60
-
61
-
62
-
63
-
64
-
65
-
66
-
67
-
68
-
69
-
70
-
71
-
72
-
73
-
74
-
75
-
76
-
77
-
78
-
79
-
80
-
81
-
82
-
83
-
84
-
85
-
86
-
87
-
88
-
89
-
90
-
91
-
92
-
93
-
94
-
95
-
96
-
97
-
98
-
99
-
100
-
101
-
102
-
103
-
104
 |
 |

13
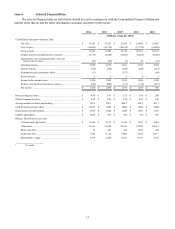
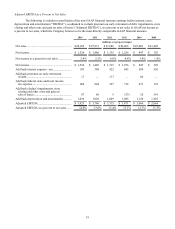
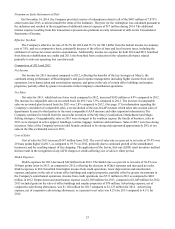
Item 6. Selected Financial Data.
The selected financial data set forth below should be read in conjunction with the Consolidated Financial Statements
and the notes thereto and the other information contained elsewhere in this report.
2014 2013 2012* 2011 2010
(millions, except per share)
Consolidated Statement of Income Data:
Net sales...................................................................................... $ 28,105 $ 27,931 $ 27,686 $ 26,405 $ 25,003
Cost of sales................................................................................ (16,863) (16,725) (16,538) (15,738) (14,824)
Gross margin............................................................................... 11,242 11,206 11,148 10,667 10,179
Selling, general and administrative expenses ............................. (8,355) (8,440) (8,482) (8,281) (8,260)
Impairments, store closing and other costs and
gain on sale of leases.............................................................. (87) (88) (5) 25 (25)
Operating income........................................................................ 2,800 2,678 2,661 2,411 1,894
Interest expense........................................................................... (395) (390) (425) (447) (513)
Premium on early retirement of debt .......................................... (17) — (137) — (66)
Interest income............................................................................ 22345
Income before income taxes ....................................................... 2,390 2,290 2,102 1,968 1,320
Federal, state and local income tax expense............................... (864) (804) (767) (712) (473)
Net income.................................................................................. $ 1,526 $ 1,486 $ 1,335 $ 1,256 $ 847
Basic earnings per share....................................................................... $ 4.30 $ 3.93 $ 3.29 $ 2.96 $ 2.00
Diluted earnings per share ................................................................... $ 4.22 $ 3.86 $ 3.24 $ 2.92 $ 1.98
Average number of shares outstanding................................................ 355.2 378.3 405.5 424.5 423.3
Cash dividends paid per share.............................................................. $ 1.1875 $ .9500 $ .8000 $ .3500 $ .2000
Depreciation and amortization............................................................. $ 1,036 $ 1,020 $ 1,049 $ 1,085 $ 1,150
Capital expenditures............................................................................. $ 1,068 $ 863 $ 942 $ 764 $ 505
Balance Sheet Data (at year end):
Cash and cash equivalents .......................................................... $ 2,246 $ 2,273 $ 1,836 $ 2,827 $ 1,464
Total assets.................................................................................. 21,461 21,620 20,991 22,095 20,631
Short-term debt ........................................................................... 76 463 124 1,103 454
Long-term debt............................................................................ 7,265 6,714 6,806 6,655 6,971
Shareholders’ equity.................................................................... 5,378 6,249 6,051 5,933 5,530
___________________
* 53 weeks