Macy's 2014 Annual Report Download - page 25
Download and view the complete annual report
Please find page 25 of the 2014 Macy's annual report below. You can navigate through the pages in the report by either clicking on the pages listed below, or by using the keyword search tool below to find specific information within the annual report.-
 1
1 -
2
-
3
-
4
-
5
-
6
-
7
-
8
-
9
-
10
-
11
-
12
-
13
-
14
-
 15
15 -
 16
16 -
 17
17 -
 18
18 -
 19
19 -
 20
20 -
 21
21 -
 22
22 -
 23
23 -
 24
24 -
 25
25 -
 26
26 -
 27
27 -
 28
28 -
 29
29 -
 30
30 -
 31
31 -
 32
32 -
 33
33 -
 34
34 -
 35
35 -
36
-
37
-
38
-
39
-
40
-
41
-
42
-
43
-
44
-
45
-
46
-
47
-
48
-
49
-
50
-
51
-
52
-
53
-
54
-
55
-
56
-
57
-
58
-
59
-
60
-
61
-
62
-
63
-
64
-
65
-
66
-
67
-
68
-
69
-
70
-
71
-
72
-
73
-
74
-
75
-
76
-
77
-
78
-
79
-
80
-
81
-
82
-
83
-
84
-
85
-
86
-
87
-
88
-
89
-
90
-
91
-
92
-
93
-
94
-
95
-
96
-
97
-
98
-
99
-
100
-
101
-
102
-
103
-
104
 |
 |

20
ROIC
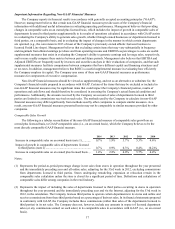
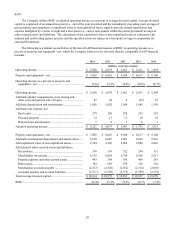
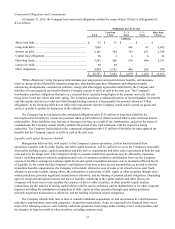
The Company defines ROIC as adjusted operating income as a percent to average invested capital. Average invested
capital is comprised of an annual two-point (i.e., end of the year presented and the immediately preceding year) average of
gross property and equipment, a capitalized value of non-capitalized leases equal to periodic annual reported net rent
expense multiplied by a factor of eight and a four-point (i.e., end of each quarter within the period presented) average of
other selected assets and liabilities. The calculation of the capitalized value of non-capitalized leases is consistent with
industry and credit rating agency practice and the specified assets are subject to a four-point average to compensate for
seasonal fluctuations.
The following is a tabular reconciliation of the non-GAAP financial measure of ROIC to operating income as a
percent to property and equipment - net, which the Company believes to be the most directly comparable GAAP financial
measure.
2014 2013 2012 2011 2010
(millions, except percentages)
Operating income .............................................................. $ 2,800 $ 2,678 $ 2,661 $ 2,411 $ 1,894
Property and equipment - net ............................................ $ 7,865 $ 8,063 $ 8,308 $ 8,617 $ 9,160
Operating income as a percent to property and
equipment - net .............................................................. 35.6% 33.2% 32.0% 28.0% 20.7%
Operating income .............................................................. $ 2,800 $ 2,678 $ 2,661 $ 2,411 $ 1,894
Add back (deduct) impairments, store closing and
other costs and gain on sale of leases............................. 87 88 5 (25) 25
Add back depreciation and amortization........................... 1,036 1,020 1,049 1,085 1,150
Add back rent expense, net
Real estate...................................................................... 279 268 258 243 235
Personal property ........................................................... 12 11 11 10 10
Deferred rent amortization............................................. 78787
Adjusted operating income................................................ $ 4,221 $ 4,073 $ 3,991 $ 3,732 $ 3,321
Property and equipment - net ............................................ $ 7,865 $ 8,063 $ 8,308 $ 8,617 $ 9,160
Add back accumulated depreciation and amortization...... 5,830 6,007 5,967 6,018 5,916
Add capitalized value of non-capitalized leases................ 2,384 2,296 2,208 2,088 2,016
Add (deduct) other selected assets and liabilities:
Receivables .................................................................... 336 339 322 294 317
Merchandise inventories................................................ 6,155 6,065 5,754 5,596 5,211
Prepaid expenses and other current assets ..................... 443 398 390 409 283
Other assets.................................................................... 784 659 579 528 526
Merchandise accounts payable ...................................... (2,472)(2,520)(2,362)(2,314)(2,085)
Accounts payable and accrued liabilities....................... (2,511)(2,328)(2,333)(2,309)(2,274)
Total average invested capital............................................ $ 18,814 $ 18,979 $ 18,833 $ 18,927 $ 19,070
ROIC.................................................................................. 22.4% 21.5% 21.2% 19.7% 17.4%