Lumber Liquidators 2015 Annual Report Download - page 73
Download and view the complete annual report
Please find page 73 of the 2015 Lumber Liquidators annual report below. You can navigate through the pages in the report by either clicking on the pages listed below, or by using the keyword search tool below to find specific information within the annual report.-
 1
1 -
2
-
3
-
4
-
5
-
6
-
7
-
8
-
9
-
10
-
11
-
12
-
13
-
14
-
15
-
16
-
17
-
18
-
19
-
20
-
21
-
22
-
23
-
24
-
25
-
26
-
27
-
28
-
29
-
30
-
31
-
32
-
33
-
34
-
35
-
36
-
37
-
38
-
39
-
40
-
41
-
42
-
43
-
44
-
45
-
46
-
47
-
48
-
49
-
50
-
51
-
52
-
53
-
54
-
55
-
56
-
57
-
58
-
59
-
60
-
61
-
62
-
 63
63 -
 64
64 -
 65
65 -
 66
66 -
 67
67 -
 68
68 -
 69
69 -
 70
70 -
 71
71 -
 72
72 -
 73
73 -
 74
74 -
 75
75 -
 76
76 -
 77
77 -
 78
78 -
 79
79 -
 80
80 -
 81
81 -
 82
82 -
 83
83 -
84
-
85
-
86
-
87
-
88
-
89
-
90
-
91
-
92
-
93
-
94
-
95
-
96
-
97
-
98
-
99
-
100
-
101
-
102
-
103
-
104
-
105
-
106
-
107
-
108
 |
 |

Lumber Liquidators Holdings, Inc.
Notes to Consolidated Financial Statements
(amounts in thousands, except share data and per share amounts)
Note 5. Leases − (continued)
As of December 31, 2015, 2014 and 2013, the Company leased the Corporate Headquarters, which
includes a store location and 30, 30 and 29 of its locations, representing 8.3%, 8.8% and 9.4% of the total
number of store leases in operation, respectively, from entities controlled by the Company’s founder, who also
serves as a member of the Board of Directors (‘‘Controlled Companies’’). During 2015, the Company also
leased a warehouse, from one of the Controlled Companies.
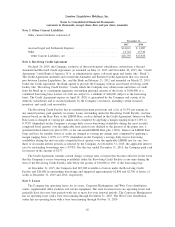
Rental expense is as follows:
Year Ended December 31,
2015 2014 2013
Rental expense ................................ $28,825 $27,995 $21,874
Rental expense related to Controlled Companies ......... 3,070 2,837 2,895
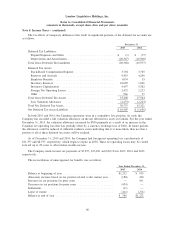
The future minimum rental payments under non-cancellable operating leases, segregating Controlled
Companies leases from all other operating leases, were as follows at December 31, 2015:
Operating Leases
Controlled Companies
Store
Leases
Distribution
Centers & Other
Leases
Total
Operating
Leases
Store
Leases
Headquarters
Lease
2016 ...................... $2,066 $1,271 $24,537 $ 2,411 $ 30,285
2017 ...................... 1,611 1,309 21,214 2,435 26,569
2018 ...................... 1,490 1,348 16,928 2,394 22,160
2019 ...................... 1,121 1,388 13,046 2,305 17,860
2020 ...................... 836 — 9,785 2,361 12,982
Thereafter .................. 1,390 — 12,206 8,452 22,048
Total minimum lease payments . . . $8,514 $5,316 $97,716 $20,358 $131,904
Note 6. Stockholders’ Equity
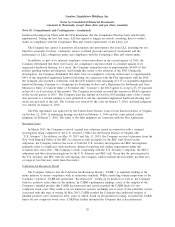
Net Income per Common Share
The following table sets forth the computation of basic and diluted net income per common share:
Year Ended December 31,
2015 2014 2013
Net (Loss) Income ...................... $ (56,433) $ 63,371 $ 77,395
Weighted Average Common Shares
Outstanding − Basic .................... 27,082,299 27,264,882 27,484,790
Effect of Dilutive Securities:
Common Stock Equivalents .............. — 220,970 429,532
Weighted Average Common Shares
Outstanding − Diluted .................. 27,082,299 27,485,852 27,914,322
Net (Loss) Income per Common Share − Basic . . . $ (2.08) $ 2.32 $ 2.82
Net (Loss) Income per Common Share − Diluted . . $ (2.08) $ 2.31 $ 2.77
63