Lumber Liquidators 2015 Annual Report Download - page 48
Download and view the complete annual report
Please find page 48 of the 2015 Lumber Liquidators annual report below. You can navigate through the pages in the report by either clicking on the pages listed below, or by using the keyword search tool below to find specific information within the annual report.-
 1
1 -
2
-
3
-
4
-
5
-
6
-
7
-
8
-
9
-
10
-
11
-
12
-
13
-
14
-
15
-
16
-
17
-
18
-
19
-
20
-
21
-
22
-
23
-
24
-
25
-
26
-
27
-
28
-
29
-
30
-
31
-
32
-
33
-
34
-
35
-
36
-
37
-
 38
38 -
 39
39 -
 40
40 -
 41
41 -
 42
42 -
 43
43 -
 44
44 -
 45
45 -
 46
46 -
 47
47 -
 48
48 -
 49
49 -
 50
50 -
 51
51 -
 52
52 -
 53
53 -
 54
54 -
 55
55 -
 56
56 -
 57
57 -
 58
58 -
59
-
60
-
61
-
62
-
63
-
64
-
65
-
66
-
67
-
68
-
69
-
70
-
71
-
72
-
73
-
74
-
75
-
76
-
77
-
78
-
79
-
80
-
81
-
82
-
83
-
84
-
85
-
86
-
87
-
88
-
89
-
90
-
91
-
92
-
93
-
94
-
95
-
96
-
97
-
98
-
99
-
100
-
101
-
102
-
103
-
104
-
105
-
106
-
107
-
108
 |
 |
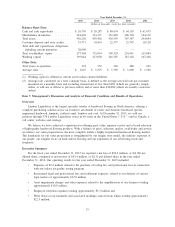
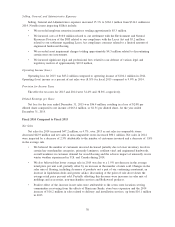
Selling, General, and Administrative Expenses
Selling, General and Administrative expenses increased 15.3% to $362.1 million from $314.1 million in
2014. Notable items impacting SG&A include:
• We recorded employee retention incentives totaling approximately $5.3 million.
• We incurred costs of $10.0 million related to our settlement with the Environment and Natural
Resources Division of the DOJ related to our compliance with the Lacey Act and $3.2 million
related to our settlement regarding Lacey Act compliance concerns related to a limited amount of
engineered hardwood flooring.
• We recorded asset impairment charges totaling approximately $4.3 million related to discontinuing
certain non-core investments.
• We incurred significant legal and professional fees related to our defense of various legal and
regulatory matters of approximately $23.8 million.
Operating Income (Loss)
Operating loss for 2015 was $83.2 million compared to operating income of $104.1 million in 2014.
Operating (loss) income as a percent of net sales was (8.5)% for fiscal 2015 compared to 9.9% in 2014.
Provision for Income Taxes
The effective tax rates for 2015 and 2014 were 32.4% and 38.8%, respectively.
Diluted Earnings per Share
Net loss for the year ended December 31, 2015 was $56.4 million, resulting in a loss of $2.08 per
diluted share compared to net income of $63.4 million, or $2.31 per diluted share, for the year ended
December 31, 2014.
Fiscal 2014 Compared to Fiscal 2013
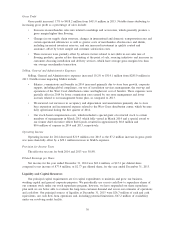
Net Sales
Net sales for 2014 increased $47.2 million, or 4.7%, over 2013 as net sales in comparable stores
decreased $42.9 million and net sales in non-comparable stores increased $90.1 million. Net sales in 2014
were impacted by a decrease of 2.5% attributable to the number of customers invoiced and a decrease of 1.8%
in the average sale.
• We believed the number of customers invoiced decreased partially due to lower inventory levels in
certain key merchandise categories, primarily laminates, resilient vinyl and engineered hardwoods,
overall weakness in customer demand for wood flooring and the adverse impact of unusually severe
winter weather experienced in U.S. and Canada during 2014.
• We also believed that lower average sale in 2014 was due to a 1.9% net decrease in the average
retail price per unit sold, partially offset by an increase in the number of units sold. Changes in the
sales mix of flooring, including clearance of products not a part of our continuing assortment, an
increase in liquidation deals and greater ad-hoc discounting at the point of sale drove down the
average retail price per unit sold. Partially offsetting this decrease were increases in sales mix of
moldings and accessories, non-merchandise services and Bellawood products.
• Positive effect of the increase in net sales were attributable to the seven store locations serving
communities recovering from the effects of Hurricane Sandy, store base expansion and the 2014
increase of $16.2 million in sales related to delivery and installation services, up from $16.1 million
in 2013.
38