Lumber Liquidators 2015 Annual Report Download - page 49
Download and view the complete annual report
Please find page 49 of the 2015 Lumber Liquidators annual report below. You can navigate through the pages in the report by either clicking on the pages listed below, or by using the keyword search tool below to find specific information within the annual report.Gross Profit
Gross profit increased 1.7% to $418.2 million from $411.0 million in 2013. Notable items attributing to
increasing gross profit as a percentage of sales include:
• Increases in merchandise sales mix related to moldings and accessories, which generally produce a
gross margin higher than flooring.
• Changes in our supply chain structure, changes in international and domestic transportation rates and
certain operational efficiencies as well as greater costs of merchandise obsolescence and shrink,
including increased inventory reserves, and our increased investment in quality control and
assurance, offset by lower sample and customer satisfaction costs.
• These increases were partially offset by adverse factors related to net shifts in our sales mix of
flooring products, greater ad-hoc discounting at the point of sale, sourcing initiatives and increases in
customers choosing installation and delivery services, which have average gross margins less than
our average merchandise transaction.
Selling, General and Administrative Expenses
Selling, General and Administrative expenses increased 10.2% to $314.1 million from $285.0 million in
2013. Notable items impacting SG&A include:
• Salaries, commissions and benefits in 2014 increased primarily due to store base growth, corporate
support, including global compliance, our test of installation services management, the start-up and
operations of the West Coast distribution center and higher net cost of benefits. These expenses were
partially offset in 2014 by lower commission rates earned by our store management and lower
accruals related to our management bonus plan, as compared to 2013.
• We incurred cost increases in occupancy and depreciation and amortization primarily due to store
base expansion and incremental expense related to the West Coast distribution center, which became
fully operational during the first quarter of 2014.
• Our stock-based compensation costs, which included a special grant of restricted stock to certain
members of management in March 2013 which fully vested in March 2014 and a special award to
our former chief executive officer Rob Lynch, resulted in approximately $0.8 million and
$0.6 million of expense in 2014 and 2013, respectively.
Operating Income
Operating income for 2014 decreased $21.9 million over 2013 as the $7.2 million increase in gross profit
was more than fully offset by a $29.1 million increase in SG&A expenses.
Provision for Income Taxes
The effective tax rate for both 2014 and 2013 was 38.8%.
Diluted Earnings per Share
Net income for the year ended December 31, 2014 was $63.4 million, or $2.31 per diluted share
compared to net income of $77.4 million, or $2.77 per diluted share, for the year ended December 31, 2013.
Liquidity and Capital Resources
Our principal capital requirements are for capital expenditures to maintain and grow our business,
working capital and general corporate purposes. We periodically use excess cash flow to repurchase shares of
our common stock under our stock repurchase program, however, we have suspended our share repurchase
plan until we are better able to evaluate the long-term customer demand and assess our estimates of operations
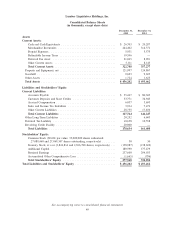
and cash flow. Our principal sources of liquidity at December 31, 2015 were $26.7 million of cash and cash
equivalents, our cash flow from operations and, including potential limitations, $67.2 million of availability
under our revolving credit facility.
39


