Lumber Liquidators 2015 Annual Report Download - page 50
Download and view the complete annual report
Please find page 50 of the 2015 Lumber Liquidators annual report below. You can navigate through the pages in the report by either clicking on the pages listed below, or by using the keyword search tool below to find specific information within the annual report.-
 1
1 -
2
-
3
-
4
-
5
-
6
-
7
-
8
-
9
-
10
-
11
-
12
-
13
-
14
-
15
-
16
-
17
-
18
-
19
-
20
-
21
-
22
-
23
-
24
-
25
-
26
-
27
-
28
-
29
-
30
-
31
-
32
-
33
-
34
-
35
-
36
-
37
-
38
-
39
-
 40
40 -
 41
41 -
 42
42 -
 43
43 -
 44
44 -
 45
45 -
 46
46 -
 47
47 -
 48
48 -
 49
49 -
 50
50 -
 51
51 -
 52
52 -
 53
53 -
 54
54 -
 55
55 -
 56
56 -
 57
57 -
 58
58 -
 59
59 -
 60
60 -
61
-
62
-
63
-
64
-
65
-
66
-
67
-
68
-
69
-
70
-
71
-
72
-
73
-
74
-
75
-
76
-
77
-
78
-
79
-
80
-
81
-
82
-
83
-
84
-
85
-
86
-
87
-
88
-
89
-
90
-
91
-
92
-
93
-
94
-
95
-
96
-
97
-
98
-
99
-
100
-
101
-
102
-
103
-
104
-
105
-
106
-
107
-
108
 |
 |

During 2015, we reduced our inventory levels which generated significant operating cash flow. In the
near term, we do not expect significant further declines in inventory levels. As such, our ability to produce
operating cash flow will be dependent upon our ability to generate net sales and operating income in future
periods. Additionally, there are significant uncertainties associated with the extent of the negative impact of
the unfavorable product allegations against us and unresolved government investigations and legal matters.
However, we believe that cash flow from operations, together with existing liquidity sources, will be sufficient
to fund our operations and anticipated capital expenditures for the foreseeable future. If the impact of these
allegations is more negative than anticipated or the outcome of legal matters is unfavorable, we may need to
seek additional sources of liquidity.
In 2016, we currently expect capital expenditures to total between $10 million and $20 million, but we
will continue to assess and adjust our level of capital expenditures based on changing circumstances. Included
in our capital requirements, we expect to selectively evaluate the opening of new stores and the remodeling
and relocating of existing stores while continuing to focus on our current store base.
Cash and Cash Equivalents
In 2015, cash and cash equivalents increased $6.4 million to $26.7 million. The increase of cash and cash
equivalents was primarily due to $9.2 million of net cash provided by operating activities and $20.0 million
borrowed under the revolving credit facility, which were partially offset by the use of $22.5 million for capital
expenditures.
In 2014, cash and cash equivalents decreased $60.3 million to $20.3 million. The decrease of cash and
cash equivalents was primarily due to $53.3 million of net cash used to repurchase common stock and
$71.1 million for capital expenditures, including the construction of our East Coast distribution center,
partially offset by net cash provided by operating activities of $57.1 million.
In 2013, cash and cash equivalents increased $16.5 million to $80.6 million. The increase of cash and
cash equivalents was primarily due to $53.0 million of net cash provided by operating activities and
$27.4 million of proceeds received from stock option exercises which was partially offset by the use of
$34.8 million to repurchase common stock and $28.6 million for capital expenditures.
Merchandise Inventories
Merchandise inventory is our most significant asset, and is considered either ‘‘available for sale’’ or
‘‘inbound in-transit,’’ based on whether we have physically received and inspected the products at an
individual store location, in our distribution centers or in another facility where we control and monitor
inspection.
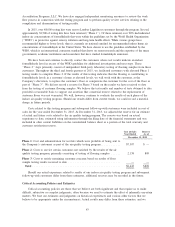
Merchandise inventories and available inventory per store in operation on December 31 were as follows:
2015 2014 2013
(in thousands)
Inventory − Available for Sale ................. $215,903 $265,949 $212,617
Inventory − Inbound In-Transit ................. 28,499 48,422 39,811
Total Merchandise Inventories ................ $244,402 $314,371 $252,428
Available Inventory Per Store ................ $ 577 $ 756 $ 669
Available inventory per store at December 31, 2015 was lower than both December 31, 2014 and
December 31, 2013. The simplification of our product assortment was part of our strategy to get back to
basics and allowed us to reduce our inventory levels while ensuring that each store location has the right mix
of product available for the customer. We believe this will enhance the shopping experience for our customers.
We recorded a lower of cost or market adjustment of approximately $22.5 million related to our inventory of
laminate products sourced from China.
Inbound in-transit inventory generally varies due to the timing of certain international shipments and
certain seasonal factors, including international holidays, rainy seasons and specific merchandise category
planning.
40