Lumber Liquidators 2015 Annual Report Download - page 46
Download and view the complete annual report
Please find page 46 of the 2015 Lumber Liquidators annual report below. You can navigate through the pages in the report by either clicking on the pages listed below, or by using the keyword search tool below to find specific information within the annual report.-
 1
1 -
2
-
3
-
4
-
5
-
6
-
7
-
8
-
9
-
10
-
11
-
12
-
13
-
14
-
15
-
16
-
17
-
18
-
19
-
20
-
21
-
22
-
23
-
24
-
25
-
26
-
27
-
28
-
29
-
30
-
31
-
32
-
33
-
34
-
35
-
 36
36 -
 37
37 -
 38
38 -
 39
39 -
 40
40 -
 41
41 -
 42
42 -
 43
43 -
 44
44 -
 45
45 -
 46
46 -
 47
47 -
 48
48 -
 49
49 -
 50
50 -
 51
51 -
 52
52 -
 53
53 -
 54
54 -
 55
55 -
 56
56 -
57
-
58
-
59
-
60
-
61
-
62
-
63
-
64
-
65
-
66
-
67
-
68
-
69
-
70
-
71
-
72
-
73
-
74
-
75
-
76
-
77
-
78
-
79
-
80
-
81
-
82
-
83
-
84
-
85
-
86
-
87
-
88
-
89
-
90
-
91
-
92
-
93
-
94
-
95
-
96
-
97
-
98
-
99
-
100
-
101
-
102
-
103
-
104
-
105
-
106
-
107
-
108
 |
 |

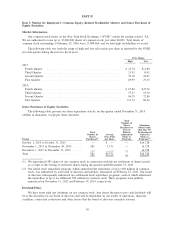
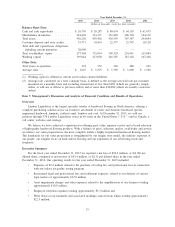
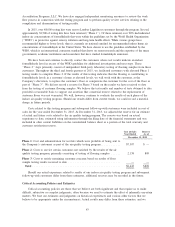
We believe the selected sales data, the percentage relationship between Net Sales and major categories in
the Consolidated Statements of Operations and the percentage change in the dollar amounts of each of the
items presented below are important in evaluating the performance of our business operations.
% of Net Sales % Increase (Decrease)
in Dollar AmountsYear Ended December 31,
2015 2014 2013
2015
vs. 2014
2014
vs. 2013
Net Sales ....................... 100.0% 100.0% 100.0% -6.6% 4.7%
Gross Profit ..................... 28.5% 39.9% 41.1% -33.3% 1.7%
Selling, General, and Administrative
Expenses ...................... 37.0% 30.0% 28.5% 15.3% 10.2%
Operating Income (Loss) ............ (8.5)% 9.9% 12.6% -179.9% -17.4%
Other (Income) Expense ............. 0.0% 0.0% (0.0)% -52.2% -210.9%
Income (Loss) Before Income Taxes .... (8.5)% 9.9% 12.6% -180.5% -18.1%
Provision for Income Taxes ........... (2.8)% 3.8% 4.9% -167.1% -18.1%
Net Income (Loss) ................. (5.8)% 6.1% 7.7% -189.1% -18.1%
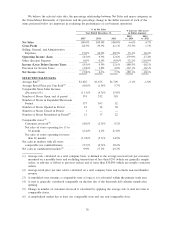
SELECTED SALES DATA
Average Sale
(1)
.................... $1,625 $1,675 $1,705 -3.1% -1.8%
Average Retail Price per Unit Sold
(2)
..... (6.0)% (1.9)% 5.7%
Comparable Store Sales Increase
(Decrease) (%) .................. (11.1)% (4.3)% 15.8%
Number of Stores Open, end of period .... 374 352 318
Number of Stores in Expanded Showroom
Format ........................ 137 103 52
Number of Stores Opened in Period ...... 23 34 30
Number of Stores Closed in Period ...... 1 — —
Number of Stores Remodeled in Period
(3)
. . 12 17 22
Comparable stores
(4)
:
Customers invoiced
(5)
.............. (8.0)% (2.5)% 9.2%
Net sales of stores operating for 13 to
36 months .................... (6.2)% 4.2% 21.8%
Net sales of stores operating for more
than 36 months ................ (11.8)% (5.1)% 14.9%
Net sales in markets with all stores
comparable (no cannibalization) ....... (9.5)% (0.3)% 18.2%
Net sales in cannibalized markets
(6)
...... 9.9% 17.2% 45.2%
(1) Average sale, calculated on a total company basis, is defined as the average invoiced sale per customer,
measured on a monthly basis and excluding transactions of less than $250 (which are generally sample
orders, or add-ons or fill-ins to previous orders) and of more than $30,000 (which are usually contractor
orders).
(2) Average retail price per unit sold is calculated on a total company basis and excludes non-merchandise
revenue.
(3) A remodeled store remains a comparable store as long as it is relocated within the primary trade area.
(4) A store is generally considered comparable on the first day of the thirteenth full calendar month after
opening.
(5) Change in number of customers invoiced is calculated by applying the average sale to total net sales at
comparable stores.
(6) A cannibalized market has at least one comparable store and one non-comparable store.
36