Lumber Liquidators 2013 Annual Report Download - page 67
Download and view the complete annual report
Please find page 67 of the 2013 Lumber Liquidators annual report below. You can navigate through the pages in the report by either clicking on the pages listed below, or by using the keyword search tool below to find specific information within the annual report.-
 1
1 -
2
-
3
-
4
-
5
-
6
-
7
-
8
-
9
-
10
-
11
-
12
-
13
-
14
-
15
-
16
-
17
-
18
-
19
-
20
-
21
-
22
-
23
-
24
-
25
-
26
-
27
-
28
-
29
-
30
-
31
-
32
-
33
-
34
-
35
-
36
-
37
-
38
-
39
-
40
-
41
-
42
-
43
-
44
-
45
-
46
-
47
-
48
-
49
-
50
-
51
-
52
-
53
-
54
-
55
-
56
-
 57
57 -
 58
58 -
 59
59 -
 60
60 -
 61
61 -
 62
62 -
 63
63 -
 64
64 -
 65
65 -
 66
66 -
 67
67 -
 68
68 -
 69
69 -
 70
70 -
 71
71 -
 72
72 -
 73
73 -
 74
74 -
 75
75 -
 76
76 -
 77
77 -
78
-
79
-
80
 |
 |
Lumber Liquidators Holdings, Inc.
Notes to Consolidated Financial Statements
(amounts in thousands, except share data and per share amounts)
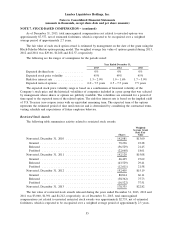
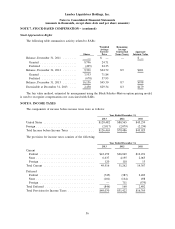
NOTE 8. INCOME TAXES − (continued)
The reconciliation of significant differences between income tax expense applying the federal statutory
rate and the actual income tax expense at the effective rate are as follows:
Year Ended December 31,
2013 2012 2011
Income Tax Expense at Federal Statutory Rate . . $44,263 35.0% $27,470 35.0% $15,059 35.0%
Increases (Decreases):
State Income Taxes, Net of Federal Income
Tax Benefit ...................... 4,146 3.3% 2,542 3.2% 1,632 3.8%
Valuation Allowance ................. 498 0.4% 1,267 1.6% — 0.0%
Foreign Taxes ...................... 328 0.2% 283 0.4% 208 0.5%
Other ............................ (165) (0.1)% (140) (0.2)% (130) (0.3)%
Total .............................. $49,070 38.8% $31,422 40.0% $16,769 39.0%
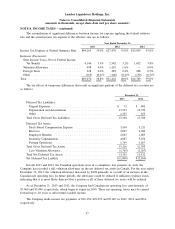
The tax effects of temporary differences that result in significant portions of the deferred tax accounts are
as follows:
December 31,
2013 2012
Deferred Tax Liabilities:
Prepaid Expenses .................................. $ 72 $ 402
Depreciation and Amortization ......................... 13,763 12,729
Other .......................................... 1,325 655
Total Gross Deferred Tax Liabilities ....................... 15,160 13,786
Deferred Tax Assets:
Stock-Based Compensation Expense ..................... 3,104 3,211
Reserves ........................................ 2,697 2,782
Employee Benefits ................................. 2,663 1,685
Inventory Capitalization .............................. 4,887 3,454
Foreign Operations ................................. 1,765 1,267
Total Gross Deferred Tax Assets .......................... 15,116 12,399
Less Valuation Allowance ............................. (1,765) (1,267)
Total Net Deferred Tax Assets ........................... 13,351 11,132
Net Deferred Tax Liability .............................. $(1,809) $ (2,654)
In both 2013 and 2012, the Canadian operations were in a cumulative loss position. As such, the
Company has recorded a full valuation allowance on the net deferred tax assets in Canada. For the year ended
December 31, 2013, the valuation allowance increased by $498 primarily as a result of an increase in the
Canadian net operating loss. In future periods, the allowance could be reduced if sufficient evidence exists
indicating that it is more likely than not that a portion or all of these deferred tax assets will be realized.
As of December 31, 2013 and 2012, the Company had Canadian net operating loss carryforwards of
$7,069 and $5,446, respectively, which begin to expire in 2030. These net operating losses may be carried
forward up to 20 years to offset future taxable income.
The Company made income tax payments of $30,154, $29,035 and $7,067 in 2013, 2012 and 2011,
respectively.
57