Lumber Liquidators 2013 Annual Report Download - page 39
Download and view the complete annual report
Please find page 39 of the 2013 Lumber Liquidators annual report below. You can navigate through the pages in the report by either clicking on the pages listed below, or by using the keyword search tool below to find specific information within the annual report.-
 1
1 -
2
-
3
-
4
-
5
-
6
-
7
-
8
-
9
-
10
-
11
-
12
-
13
-
14
-
15
-
16
-
17
-
18
-
19
-
20
-
21
-
22
-
23
-
24
-
25
-
26
-
27
-
28
-
 29
29 -
 30
30 -
 31
31 -
 32
32 -
 33
33 -
 34
34 -
 35
35 -
 36
36 -
 37
37 -
 38
38 -
 39
39 -
 40
40 -
 41
41 -
 42
42 -
 43
43 -
 44
44 -
 45
45 -
 46
46 -
 47
47 -
 48
48 -
 49
49 -
50
-
51
-
52
-
53
-
54
-
55
-
56
-
57
-
58
-
59
-
60
-
61
-
62
-
63
-
64
-
65
-
66
-
67
-
68
-
69
-
70
-
71
-
72
-
73
-
74
-
75
-
76
-
77
-
78
-
79
-
80
 |
 |

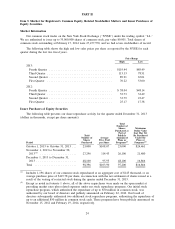
Supply Chain Optimization
In August 2013, we reached agreements to strengthen the long-term structure of our supply chain through
the consolidation and expansion of our distribution facilities. On the East Coast, we purchased 110 acres of
undeveloped land in Henrico County, Virginia where we are constructing a 1.0 million square foot distribution
center to consolidate and enhance existing operations, which currently utilize 750,000 square feet across four
separate buildings. We are targeting an opening date late in the fourth quarter of 2014. On the West Coast, we
are leasing a 500,000 square foot distribution center in Pomona, California to further strengthen the
availability of our entire product assortment, particularly to those customers in the Western U.S. This facility
is expected to be fully operational by the end of the first quarter of 2014.
We expect capital expenditures for land, building and equipment to range up to $53 million for the East
Coast facility, of which $8.4 million was incurred in 2013. For the West Coast facility, we expect up to
$4 million in capital expenditures, primarily for equipment, of which approximately half was incurred in 2013.
We expect to fund all expenditures using existing cash and operating cash flow.
In 2013, incremental selling, general and administrative (‘‘SG&A’’) expenses related to the West Coast
distribution center were $0.5 million. Once fully operational, we expect SG&A expenses, primarily occupancy
and wages, up to $2.0 million per quarter, with full year 2014 incremental SG&A expenses of up to
$7.5 million. Once these facilities are fully operational, we expect a net benefit to operating income as our
value proposition is strengthened, operations are more efficient and certain costs are lowered, including
transportation and occupancy.
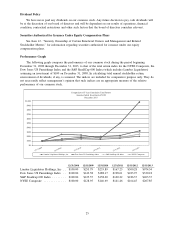
Share Repurchase
In 2012, our board of directors authorized the repurchase of up to $100.0 million of our common stock,
and through December 31, 2013, we had repurchased approximately 2.1 million shares of our common stock,
through open market purchases, using approximately $83.1 million in cash.
In January 2014, our board of directors increased the authorization by an additional $50.0 million. We
continue to believe the stock repurchase program is an important part of returning value to our shareholders,
and expresses our long-term confidence in our proven store model and growth potential.
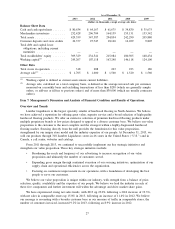
Results of Operations
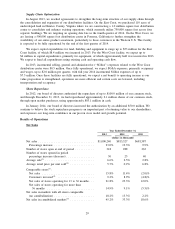
Net Sales
Year Ended December 31,
2013 2012 2011
(dollars in thousands)
Net sales ................................ $1,000,240 $813,327 $681,587
Percentage increase ....................... 23.0% 19.3% 9.9%
Number of stores open at end of period ........... 318 288 263
Number of stores opened in period
percentage increase (decrease) ................ 30 25 40
Average sale
(1)
............................ 6.6% 2.5% 2.8%
Average retail price per unit sold
(2)
.............. 5.7% 0.2% 6.8%
Comparable stores
(3)
:
Net sales .............................. 15.8% 11.4% (2.0)%
Customers invoiced
(4)
..................... 9.2% 8.9% (4.8)%
Net sales of stores operating for 13 to 36 months . . . 21.8% 23.3% 12.0%
Net sales of stores operating for more than
36 months ........................... 14.9% 9.1% (5.5)%
Net sales in markets with all stores comparable
(no cannibalization) ....................... 18.2% 13.3% 2.2%
Net sales in cannibalized markets
(5)
.............. 45.2% 33.3% 18.6%
29