Lumber Liquidators 2013 Annual Report Download - page 35
Download and view the complete annual report
Please find page 35 of the 2013 Lumber Liquidators annual report below. You can navigate through the pages in the report by either clicking on the pages listed below, or by using the keyword search tool below to find specific information within the annual report.-
 1
1 -
2
-
3
-
4
-
5
-
6
-
7
-
8
-
9
-
10
-
11
-
12
-
13
-
14
-
15
-
16
-
17
-
18
-
19
-
20
-
21
-
22
-
23
-
24
-
 25
25 -
 26
26 -
 27
27 -
 28
28 -
 29
29 -
 30
30 -
 31
31 -
 32
32 -
 33
33 -
 34
34 -
 35
35 -
 36
36 -
 37
37 -
 38
38 -
 39
39 -
 40
40 -
 41
41 -
 42
42 -
 43
43 -
 44
44 -
 45
45 -
46
-
47
-
48
-
49
-
50
-
51
-
52
-
53
-
54
-
55
-
56
-
57
-
58
-
59
-
60
-
61
-
62
-
63
-
64
-
65
-
66
-
67
-
68
-
69
-
70
-
71
-
72
-
73
-
74
-
75
-
76
-
77
-
78
-
79
-
80
 |
 |
Dividend Policy
We have never paid any dividends on our common stock. Any future decision to pay cash dividends will
be at the discretion of our board of directors and will be dependent on our results of operations, financial
condition, contractual restrictions and other such factors that the board of directors considers relevant.
Securities Authorized for Issuance Under Equity Compensation Plans
See Item 12. ‘‘Security Ownership of Certain Beneficial Owners and Management and Related
Stockholder Matters’’ for information regarding securities authorized for issuance under our equity
compensation plans.
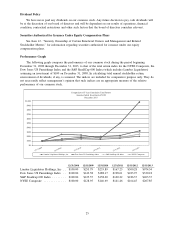
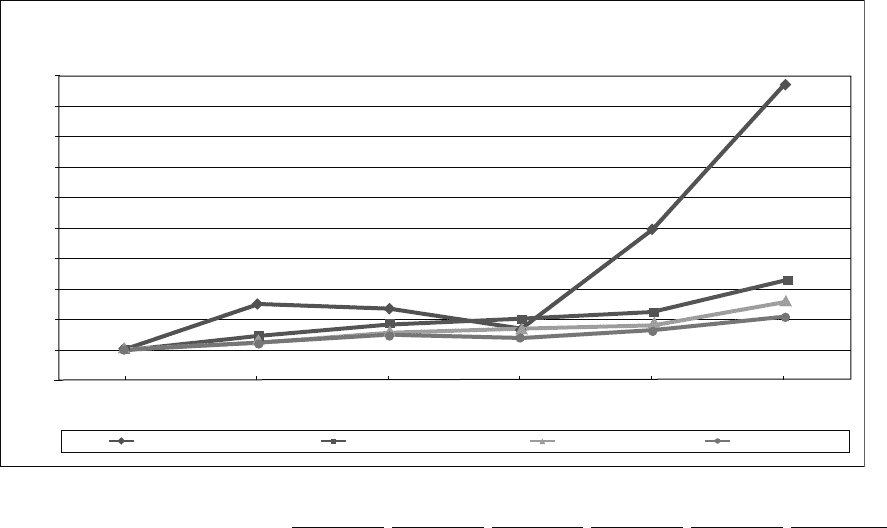
Performance Graph
The following graph compares the performance of our common stock during the period beginning
December 31, 2008 through December 31, 2013, to that of the total return index for the NYSE Composite, the
Dow Jones US Furnishings Index and the S&P SmallCap 600 Index (which includes Lumber Liquidators)
assuming an investment of $100 on December 31, 2008. In calculating total annual stockholder return,
reinvestment of dividends, if any, is assumed. The indices are included for comparative purpose only. They do
not necessarily reflect management’s opinion that such indices are an appropriate measure of the relative
performance of our common stock.
Comparison of 5 Year Cumulative Total Return
Assumes Initial Investment of $100
December 2013
$1,000
$900
$800
$700
$600
$500
$400
$300
$200
$100
$0
Lumber Liquidators Holdings, Inc.
12/31/2008
12/31/2009
12/31/2010
12/31/2011
12/31/2012
12/31/2013
Dow Jones US Furnishings Index S&P Smallcap 600 Index NYSE Composite
12/31/2008 12/31/2009 12/31/2010 12/31/2011 12/31/2012 12/31/2013
Lumber Liquidators Holdings, Inc . . $100.00 $253.79 $235.89 $167.23 $500.28 $974.34
Dow Jones US Furnishings Index . . $100.00 $143.58 $188.17 $198.61 $223.97 $330.18
S&P Smallcap 600 Index ........ $100.00 $125.57 $158.60 $160.22 $186.37 $263.37
NYSE Composite ............. $100.00 $128.95 $146.69 $141.46 $164.45 $207.85
25