Lumber Liquidators 2013 Annual Report Download - page 44
Download and view the complete annual report
Please find page 44 of the 2013 Lumber Liquidators annual report below. You can navigate through the pages in the report by either clicking on the pages listed below, or by using the keyword search tool below to find specific information within the annual report.-
 1
1 -
2
-
3
-
4
-
5
-
6
-
7
-
8
-
9
-
10
-
11
-
12
-
13
-
14
-
15
-
16
-
17
-
18
-
19
-
20
-
21
-
22
-
23
-
24
-
25
-
26
-
27
-
28
-
29
-
30
-
31
-
32
-
33
-
 34
34 -
 35
35 -
 36
36 -
 37
37 -
 38
38 -
 39
39 -
 40
40 -
 41
41 -
 42
42 -
 43
43 -
 44
44 -
 45
45 -
 46
46 -
 47
47 -
 48
48 -
 49
49 -
 50
50 -
 51
51 -
 52
52 -
 53
53 -
 54
54 -
55
-
56
-
57
-
58
-
59
-
60
-
61
-
62
-
63
-
64
-
65
-
66
-
67
-
68
-
69
-
70
-
71
-
72
-
73
-
74
-
75
-
76
-
77
-
78
-
79
-
80
 |
 |

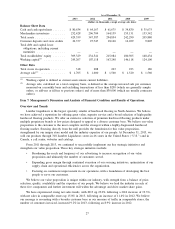
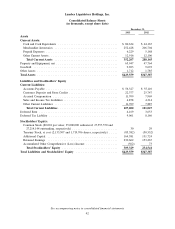
Cash and Cash Equivalents
In 2013, cash and cash equivalents increased $16.5 million to $80.6 million. The increase of cash and
cash equivalents was primarily due to $53.0 million of net cash provided by operating activities and
$27.4 million of proceeds received from stock option exercises which was partially offset by the use of
$34.8 million to repurchase common stock and $28.6 million for capital expenditures.
In 2012, cash and cash equivalents increased $2.5 million to $64.2 million. The increase of cash and cash
equivalents was primarily due to $47.3 million of net cash provided by operating activities and $17.6 million
of proceeds received from stock option exercises which was partially offset by the use of $49.4 million to
repurchase common stock and $13.4 million for capital expenditures.
In 2011, cash and cash equivalents increased $26.8 million to $61.7 million as $44.1 million of cash
provided by operating activities and $4.8 million of proceeds received from stock option exercises were
partially offset by the use of $17.0 million for capital expenditures and $4.7 million to acquire certain assets
in China.
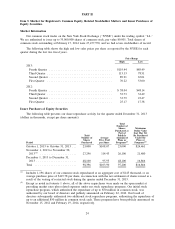
Merchandise Inventories
Merchandise inventory is our most significant asset, and is considered either ‘‘available for sale’’ or
‘‘inbound in-transit,’’ based on whether we have physically received and inspected the products at an
individual store location, in our distribution centers or in another facility where we control and monitor
inspection.
Merchandise inventories and available inventory per store in operation on December 31 were as follows:
2013 2012 2011
(in thousands)
Inventory − Available for Sale ................. $212,617 $168,409 $135,850
Inventory − Inbound In-Transit ................. 39,811 38,295 28,289
Total Merchandise Inventories ................ $252,428 $206,704 $164,139
Available Inventory Per Store ................ $ 669 $ 585 $ 517
Available inventory per store at December 31, 2013 was within our targeted range of $660,000 to
$680,000, as we built inventory earlier than in prior years around known events such as the South American
rainy season and Chinese New Year, built safety stock in conjunction with our supply chain optimization and
adjusted to updated sales projections for 2014. Year-end inventory levels in both 2012 and 2011 had been
impacted by our sourcing initiatives. We believe our inventory levels are well-aligned to our projected sales
mix. We expect to end 2014 with available inventory per store between $580,000 and $620,000.
Inbound in-transit inventory generally varies due to the timing of certain international shipments, but may
also be influenced by seasonal factors, including international holidays, rainy seasons and specific merchandise
category planning.
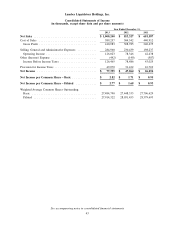
Cash Flows
Operating Activities. Net cash provided by operating activities was $53.0 million for 2013,
$47.3 million for 2012 and $44.1 million for 2011. The $5.7 million increase in net cash comparing 2013 to
2012 is primarily due to more profitable operations which were partially offset by a larger and earlier build in
merchandise inventories net of the change in accounts payable. The $3.2 million increase in net cash
comparing 2012 to 2011 was primarily due to more profitable operations which were partially offset by a
larger build in merchandise inventories net of the change in accounts payable.
Investing Activities. Net cash used in investing activities was $28.6 million for 2013, $13.4 million for
2012 and $21.7 million for 2011. Net cash used in investing activities in each year included capital purchases
for store base expansion, and in 2013, for major remodeling of 22 existing stores to our store of the future
format. Each year included investments in and maintenance of forklifts, our integrated information technology
solution, our finishing line and our Corporate Headquarters. In 2013, capital expenditures also included
$8.4 million for land and buildings for the East Coast distribution facility and $2.1 million for equipment and
34