Lumber Liquidators 2013 Annual Report Download - page 41
Download and view the complete annual report
Please find page 41 of the 2013 Lumber Liquidators annual report below. You can navigate through the pages in the report by either clicking on the pages listed below, or by using the keyword search tool below to find specific information within the annual report.-
 1
1 -
2
-
3
-
4
-
5
-
6
-
7
-
8
-
9
-
10
-
11
-
12
-
13
-
14
-
15
-
16
-
17
-
18
-
19
-
20
-
21
-
22
-
23
-
24
-
25
-
26
-
27
-
28
-
29
-
30
-
 31
31 -
 32
32 -
 33
33 -
 34
34 -
 35
35 -
 36
36 -
 37
37 -
 38
38 -
 39
39 -
 40
40 -
 41
41 -
 42
42 -
 43
43 -
 44
44 -
 45
45 -
 46
46 -
 47
47 -
 48
48 -
 49
49 -
 50
50 -
 51
51 -
52
-
53
-
54
-
55
-
56
-
57
-
58
-
59
-
60
-
61
-
62
-
63
-
64
-
65
-
66
-
67
-
68
-
69
-
70
-
71
-
72
-
73
-
74
-
75
-
76
-
77
-
78
-
79
-
80
 |
 |

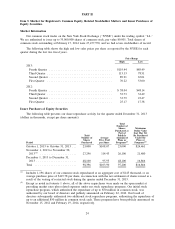
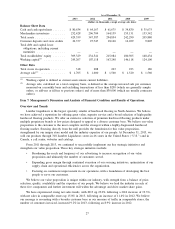
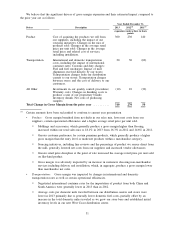
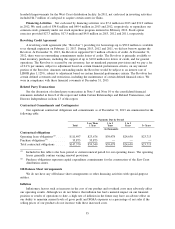
We believe that the significant drivers of gross margin expansion and their estimated impact compared to
the prior year are as follows:
Year Ended December 31,
Driver Description 2013 2012
(1)
2011
(1)
expansion (contraction) in basis
points
Product Cost of acquiring the products we sell from
our suppliers, including the impact of our
sourcing initiatives; Changes in the mix of
products sold; Changes in the average retail
price per unit sold; Changes in the average
retail price and related cost of services,
including installation.
300 230 140
Transportation International and domestic transportation
costs, including the impact of international
container rates; Customs and duty charges;
Fuel and fuel surcharges; Impact of mill
shipments received directly by our stores;
Transportation charges from our distribution
centers to our stores; Transportation charges
between stores and the cost of delivery to our
customers.
20 30 (60)
All Other Investments in our quality control procedures;
Warranty costs; Changes in finishing costs to
produce a unit of our proprietary brands;
Inventory shrink; Net costs of producing
samples.
(10) 10 (30)
Total Change in Gross Margin from the prior year .......... 310 270 50
(1)
Certain amounts have been reclassified to conform to current year presentation
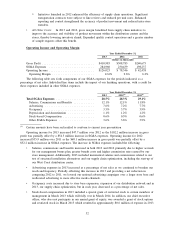
•Product: Gross margin benefited from net shifts in our sales mix, lower net costs from our
suppliers, certain operational efficiencies and a higher average retail price per unit sold.
䡩Moldings and accessories, which generally produce a gross margin higher than flooring,
increased within our total sales mix to 18.1% in 2013 from 16.3% in 2012 and 14.6% in 2011.
䡩Greater customer preference for certain premium products, which generally produce a higher
gross margin than the entry level or moderate products within a merchandise category.
䡩Sourcing initiatives, including line reviews and the percentage of product we source direct from
the mill, generally lowered net costs from our suppliers and increased vendor allowances.
䡩Greater retail price discipline at the point of sale increased the average retail price per unit sold
on like-kind product.
䡩Gross margin was adversely impacted by an increase in customers choosing non-merchandise
services including delivery and installation, which, in aggregate, produce a gross margin lower
than merchandise net sales.
•Transportation: Gross margin was impacted by changes in international and domestic
transportation rates as well as certain operational efficiencies.
䡩Negotiated international container rates for the importation of product from both China and
South America were generally lower in 2013 than in 2012.
䡩Average costs per domestic mile traveled between our distribution centers and stores were
lower in 2013 primarily due to generally lower domestic fuel costs, partially offset by an
increase in the total domestic miles traveled as we grew our store base and established initial
inventory levels in our new West Coast distribution center.
31