Lumber Liquidators 2013 Annual Report Download - page 42
Download and view the complete annual report
Please find page 42 of the 2013 Lumber Liquidators annual report below. You can navigate through the pages in the report by either clicking on the pages listed below, or by using the keyword search tool below to find specific information within the annual report.-
 1
1 -
2
-
3
-
4
-
5
-
6
-
7
-
8
-
9
-
10
-
11
-
12
-
13
-
14
-
15
-
16
-
17
-
18
-
19
-
20
-
21
-
22
-
23
-
24
-
25
-
26
-
27
-
28
-
29
-
30
-
31
-
 32
32 -
 33
33 -
 34
34 -
 35
35 -
 36
36 -
 37
37 -
 38
38 -
 39
39 -
 40
40 -
 41
41 -
 42
42 -
 43
43 -
 44
44 -
 45
45 -
 46
46 -
 47
47 -
 48
48 -
 49
49 -
 50
50 -
 51
51 -
 52
52 -
53
-
54
-
55
-
56
-
57
-
58
-
59
-
60
-
61
-
62
-
63
-
64
-
65
-
66
-
67
-
68
-
69
-
70
-
71
-
72
-
73
-
74
-
75
-
76
-
77
-
78
-
79
-
80
 |
 |

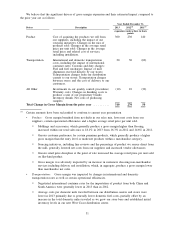
䡩Initiatives launched in 2012 enhanced the efficiency of supply chain operations. Significant
transportation contracts were subject to line reviews and reduced per unit rates. Enhanced
reporting and control strengthened the accuracy of product movement and reduced inter-store
transfers.
•All Other Costs: In 2013 and 2012, gross margin benefitted from supply chain initiatives to
improve the accuracy and visibility of product movement within the distribution centers and the
stores, thereby lowering inventory shrink. Expanded quality control operations and a greater number
of sample requests offset this benefit.
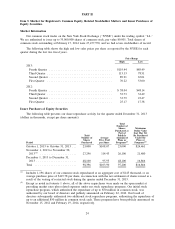
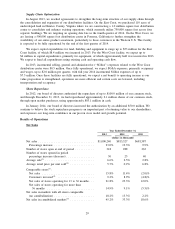
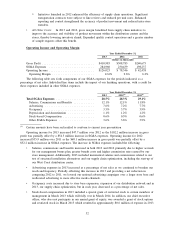
Operating Income and Operating Margin
Year Ended December 31,
2013 2012 2011
(dollars in thousands)
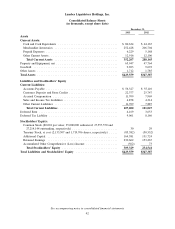
Gross Profit .............................. $410,983 $308,785 $240,675
SG&A Expenses .......................... 284,960 230,439 198,237
Operating Income .......................... $126,023 $ 78,346 $ 42,438
Operating Margin ........................ 12.6% 9.6% 6.2%
The following table sets forth components of our SG&A expenses for the periods indicated, as a
percentage of net sales. Individual line items include the impact of our finishing operations, with a credit for
these expenses included in other SG&A expenses.
Year Ended December 31,
2013 2012
(1)
2011
(1)
Total SG&A Expenses ...................... 28.5% 28.3% 29.1%
Salaries, Commissions and Benefits ............ 12.1% 12.1% 11.8%
Advertising ............................ 7.6% 7.2% 7.7%
Occupancy ............................. 3.5% 3.7% 3.9%
Depreciation and Amortization ............... 1.1% 1.2% 1.2%
Stock-based Compensation .................. 0.6% 0.5% 0.6%
Other SG&A Expenses .................... 3.6% 3.6% 3.9%
(1)
Certain amounts have been reclassified to conform to current year presentation
Operating income for 2013 increased $47.7 million over 2012 as the $102.2 million increase in gross
profit was partially offset by a $54.5 million increase in SG&A expenses. Operating income for 2012
increased $35.9 million over 2011 as the $68.1 million increase in gross profit was partially offset by a
$32.2 million increase in SG&A expenses. The increase in SG&A expenses included the following:
• Salaries, commissions and benefits increased in both 2013 and 2012 primarily due to higher accruals
for our management bonus plan, greater benefit costs and higher commission rates earned by our
store management. Additionally, 2013 included incremental salaries and commissions related to our
test of structural installation alternatives and our supply chain optimization, including the start-up of
our West Coast distribution center.
• Advertising expenses in 2013 increased as a percentage of net sales as we continued to broaden our
reach and frequency. Partially offsetting this increase in 2013 and providing a net reduction in
comparing 2012 to 2011, we levered our national advertising campaigns over a larger store base and
reallocated advertising to more effective media channels.
• Occupancy costs increased due to store base expansion, expansion of our distribution network and in
2013, our supply chain optimization, but in each year, decreased as a percentage of net sales.
• Stock-based compensation in 2013 included a special grant of restricted stock to certain members of
management in March 2013 which will fully vest in March 2014. In addition, our chief executive
officer, who does not participate in our annual grant of equity, was awarded a grant of stock options
and restricted stock in March 2013 which resulted in approximately $0.6 million of expense in 2013.
32