Lumber Liquidators 2013 Annual Report Download - page 63
Download and view the complete annual report
Please find page 63 of the 2013 Lumber Liquidators annual report below. You can navigate through the pages in the report by either clicking on the pages listed below, or by using the keyword search tool below to find specific information within the annual report.-
 1
1 -
2
-
3
-
4
-
5
-
6
-
7
-
8
-
9
-
10
-
11
-
12
-
13
-
14
-
15
-
16
-
17
-
18
-
19
-
20
-
21
-
22
-
23
-
24
-
25
-
26
-
27
-
28
-
29
-
30
-
31
-
32
-
33
-
34
-
35
-
36
-
37
-
38
-
39
-
40
-
41
-
42
-
43
-
44
-
45
-
46
-
47
-
48
-
49
-
50
-
51
-
52
-
 53
53 -
 54
54 -
 55
55 -
 56
56 -
 57
57 -
 58
58 -
 59
59 -
 60
60 -
 61
61 -
 62
62 -
 63
63 -
 64
64 -
 65
65 -
 66
66 -
 67
67 -
 68
68 -
 69
69 -
 70
70 -
 71
71 -
 72
72 -
 73
73 -
74
-
75
-
76
-
77
-
78
-
79
-
80
 |
 |

Lumber Liquidators Holdings, Inc.
Notes to Consolidated Financial Statements
(amounts in thousands, except share data and per share amounts)
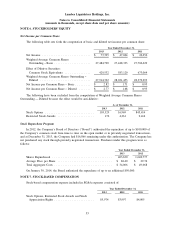
NOTE 6. STOCKHOLDERS’ EQUITY
Net Income per Common Share
The following table sets forth the computation of basic and diluted net income per common share:
Year Ended December 31,
2013 2012 2011
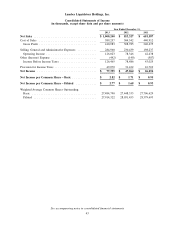
Net Income ............................ $ 77,395 $ 47,064 $ 26,256
Weighted Average Common Shares
Outstanding − Basic ..................... 27,484,790 27,448,333 27,706,629
Effect of Dilutive Securities:
Common Stock Equivalents ............... 429,532 583,120 673,064
Weighted Average Common Shares Outstanding −
Diluted ............................. 27,914,322 28,031,453 28,379,693
Net Income per Common Share − Basic ......... $ 2.82 $ 1.71 $ 0.95
Net Income per Common Share − Diluted ....... $ 2.77 $ 1.68 $ 0.93
The following have been excluded from the computation of Weighted Average Common Shares
Outstanding — Diluted because the effect would be anti-dilutive:
As of December 31,
2013 2012 2011
Stock Options ............................ 103,329 16,969 845,414
Restricted Stock Awards ..................... 176 4,261 9,414
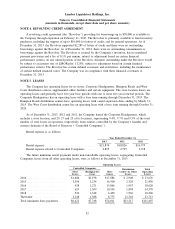
Stock Repurchase Program
In 2012, the Company’s Board of Directors (‘‘Board’’) authorized the repurchase of up to $100,000 of
the Company’s common stock from time to time on the open market or in privately negotiated transactions,
and at December 31, 2013, the Company had $16,866 remaining under this authorization. The Company has
not purchased any stock through privately negotiated transactions. Purchases under this program were as
follows:
Year Ended December 31,
2013 2012
Shares Repurchased .................................. 403,630 1,648,777
Average Price per Share ............................... $ 84.40 $ 29.74
Total Aggregate Costs ................................. $ 34,066 $ 49,068
On January 30, 2014, the Board authorized the repurchase of up to an additional $50,000.
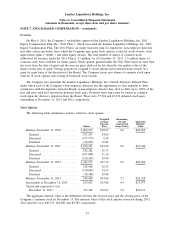
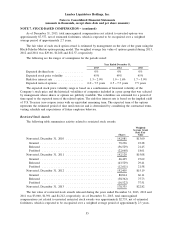
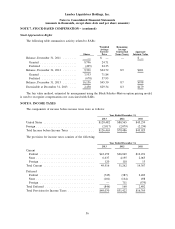
NOTE 7. STOCK-BASED COMPENSATION
Stock-based compensation expense included in SG&A expenses consisted of:
Year Ended December 31,
2013 2012 2011
Stock Options, Restricted Stock Awards and Stock
Appreciation Rights ....................... $5,974 $3,997 $4,005
53