Lumber Liquidators 2013 Annual Report Download - page 56
Download and view the complete annual report
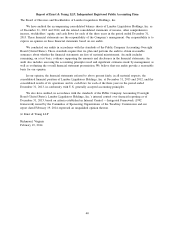
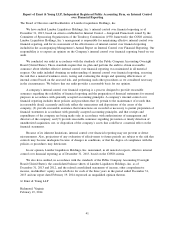
Please find page 56 of the 2013 Lumber Liquidators annual report below. You can navigate through the pages in the report by either clicking on the pages listed below, or by using the keyword search tool below to find specific information within the annual report.-
 1
1 -
2
-
3
-
4
-
5
-
6
-
7
-
8
-
9
-
10
-
11
-
12
-
13
-
14
-
15
-
16
-
17
-
18
-
19
-
20
-
21
-
22
-
23
-
24
-
25
-
26
-
27
-
28
-
29
-
30
-
31
-
32
-
33
-
34
-
35
-
36
-
37
-
38
-
39
-
40
-
41
-
42
-
43
-
44
-
45
-
 46
46 -
 47
47 -
 48
48 -
 49
49 -
 50
50 -
 51
51 -
 52
52 -
 53
53 -
 54
54 -
 55
55 -
 56
56 -
 57
57 -
 58
58 -
 59
59 -
 60
60 -
 61
61 -
 62
62 -
 63
63 -
 64
64 -
 65
65 -
 66
66 -
67
-
68
-
69
-
70
-
71
-
72
-
73
-
74
-
75
-
76
-
77
-
78
-
79
-
80
 |
 |

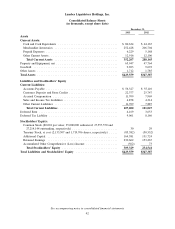
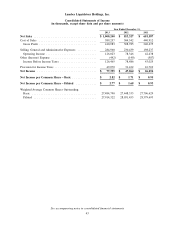
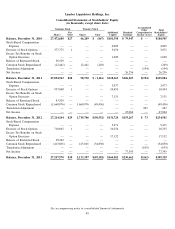
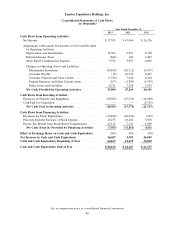
Lumber Liquidators Holdings, Inc.
Consolidated Statements of Cash Flows
(in thousands)
Year Ended December 31,
2013 2012 2011
Cash Flows from Operating Activities:
Net Income ................................... $77,395 $ 47,064 $ 26,256
Adjustments to Reconcile Net Income to Net Cash Provided
by Operating Activities:
Depreciation and Amortization .................... 11,666 9,957 8,328
Deferred Income Taxes ......................... (846) 160 2,402
Stock-Based Compensation Expense ................ 5,974 3,997 4,005
Changes in Operating Assets and Liabilities:
Merchandise Inventories ....................... (45,834) (42,712) (9,197)
Accounts Payable ........................... (15) 16,756 4,467
Customer Deposits and Store Credits .............. (3,354) 7,626 6,104
Prepaid Expenses and Other Current Assets .......... (257) (2,835) (1,943)
Other Assets and Liabilities ..................... 8,271 7,256 3,679
Net Cash Provided by Operating Activities .......... 53,000 47,269 44,101
Cash Flows from Investing Activities:
Purchases of Property and Equipment ................. (28,585) (13,376) (16,988)
Cash Paid for Acquisition ......................... — — (4,725)
Net Cash Used in Investing Activities .............. (28,585) (13,376) (21,713)
Cash Flows from Financing Activities:
Payments for Stock Repurchases ..................... (34,830) (49,436) (249)
Proceeds from the Exercise of Stock Options ............ 10,255 10,454 3,070
Excess Tax Benefit from Stock-Based Compensation ....... 17,132 7,131 1,690
Net Cash (Used in) Provided by Financing Activities ... (7,443) (31,851) 4,511
Effect of Exchange Rates on Cash and Cash Equivalents .... (505) 450 (54)
Net Increase in Cash and Cash Equivalents ............. 16,467 2,492 26,845
Cash and Cash Equivalents, Beginning of Year ........... 64,167 61,675 34,830
Cash and Cash Equivalents, End of Year ............... $ 80,634 $ 64,167 $ 61,675
See accompanying notes to consolidated financial statements
46