Lumber Liquidators 2013 Annual Report Download - page 37
Download and view the complete annual report
Please find page 37 of the 2013 Lumber Liquidators annual report below. You can navigate through the pages in the report by either clicking on the pages listed below, or by using the keyword search tool below to find specific information within the annual report.-
 1
1 -
2
-
3
-
4
-
5
-
6
-
7
-
8
-
9
-
10
-
11
-
12
-
13
-
14
-
15
-
16
-
17
-
18
-
19
-
20
-
21
-
22
-
23
-
24
-
25
-
26
-
 27
27 -
 28
28 -
 29
29 -
 30
30 -
 31
31 -
 32
32 -
 33
33 -
 34
34 -
 35
35 -
 36
36 -
 37
37 -
 38
38 -
 39
39 -
 40
40 -
 41
41 -
 42
42 -
 43
43 -
 44
44 -
 45
45 -
 46
46 -
 47
47 -
48
-
49
-
50
-
51
-
52
-
53
-
54
-
55
-
56
-
57
-
58
-
59
-
60
-
61
-
62
-
63
-
64
-
65
-
66
-
67
-
68
-
69
-
70
-
71
-
72
-
73
-
74
-
75
-
76
-
77
-
78
-
79
-
80
 |
 |

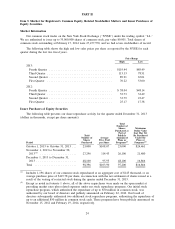
As of December 31,
2013 2012 2011 2010 2009
(dollars in thousands, except average sale data)
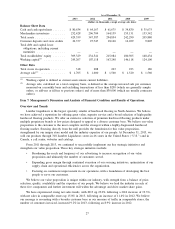
Balance Sheet Data
Cash and cash equivalents ....... $ 80,634 $ 64,167 $ 61,675 $ 34,830 $ 35,675
Merchandise inventories ........ 252,428 206,704 164,139 155,131 133,342
Total assets ................. 429,559 347,387 294,854 242,290 205,880
Customer deposits and store credits 22,377 25,747 18,120 12,039 9,805
Total debt and capital lease
obligations, including current
maturities ................ ———— —
Total stockholders’ equity ....... 309,329 234,541 215,084 180,505 148,434
Working capital
(1)
............ 245,207 187,118 167,248 146,118 124,100
Other Data
Total stores in operation ........ 318 288 263 223 186
Average sale
(2)
.............. $ 1,705 $ 1,600 $ 1,560 $ 1,520 $ 1,560
(1)
Working capital is defined as current assets minus current liabilities.
(2)
Average sale, calculated on a total company basis, is defined as the average invoiced sale per customer,
measured on a monthly basis and excluding transactions of less than $250 (which are generally sample
orders, or add-ons or fill-ins to previous orders) and of more than $30,000 (which are usually contractor
orders).
Item 7. Management’s Discussion and Analysis of Financial Condition and Results of Operations.
Overview and Trends
Lumber Liquidators is the largest specialty retailer of hardwood flooring in North America. We believe
we have achieved a reputation for offering great value, superior service and a broad selection of high-quality
hardwood flooring products. We offer an extensive selection of premium hardwood flooring products under
multiple proprietary brands at low prices designed to appeal to a diverse customer base. We believe our value
proposition to the customer is the most complete and the strongest within a highly-fragmented hardwood
flooring market. Sourcing directly from the mill provides the foundation for this value proposition,
strengthened by our unique store model and the industry expertise of our people. At December 31, 2013, we
sold our products through 318 Lumber Liquidators stores in 46 states in the United States (‘‘U.S.’’) and in
Canada, a call center, websites and catalogs.
From 2011 through 2013, we continued to successfully implement our key strategic initiatives and
strengthen our value proposition. These key strategic initiatives include:
• Broadening the reach and frequency of our advertising to increase recognition of our value
proposition and ultimately the number of customers served.
• Expanding gross margin through continued execution of our sourcing initiatives, optimization of our
supply chain and operational efficiencies across the organization.
• Focusing on continuous improvement in our operations, with a foundation of developing the best
people to serve our customers.
We believe our value proposition is unique within our industry, with strength from a balance of price,
selection, quality, availability and the expertise of our people. We believe we lead the industry in each of
these five components and further investment will widen the advantage and drive market share gains.
We have experienced strong net sales trends, with 2013 up 23.0% following a 2012 increase of 19.3%,
with net sales in comparable stores up 15.8% in 2013, following an increase of 11.4% in 2012. We believe
our message is resonating with a broader customer base as our measure of traffic in comparable stores, the
number of customers invoiced, increased 9.2% in 2013, following an 8.9% increase in 2012.
27