Lumber Liquidators 2013 Annual Report Download - page 34
Download and view the complete annual report
Please find page 34 of the 2013 Lumber Liquidators annual report below. You can navigate through the pages in the report by either clicking on the pages listed below, or by using the keyword search tool below to find specific information within the annual report.-
 1
1 -
2
-
3
-
4
-
5
-
6
-
7
-
8
-
9
-
10
-
11
-
12
-
13
-
14
-
15
-
16
-
17
-
18
-
19
-
20
-
21
-
22
-
23
-
 24
24 -
 25
25 -
 26
26 -
 27
27 -
 28
28 -
 29
29 -
 30
30 -
 31
31 -
 32
32 -
 33
33 -
 34
34 -
 35
35 -
 36
36 -
 37
37 -
 38
38 -
 39
39 -
 40
40 -
 41
41 -
 42
42 -
 43
43 -
 44
44 -
45
-
46
-
47
-
48
-
49
-
50
-
51
-
52
-
53
-
54
-
55
-
56
-
57
-
58
-
59
-
60
-
61
-
62
-
63
-
64
-
65
-
66
-
67
-
68
-
69
-
70
-
71
-
72
-
73
-
74
-
75
-
76
-
77
-
78
-
79
-
80
 |
 |
PART II
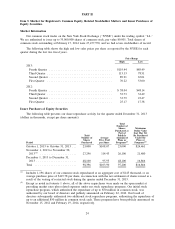
Item 5. Market for Registrant’s Common Equity, Related Stockholder Matters and Issuer Purchases of
Equity Securities.
Market Information
Our common stock trades on the New York Stock Exchange (‘‘NYSE’’) under the trading symbol ‘‘LL.’’
We are authorized to issue up to 35,000,000 shares of common stock, par value $0.001. Total shares of
common stock outstanding at February 17, 2014 were 27,477,570, and we had seven stockholders of record.
The following table shows the high and low sales prices per share as reported by the NYSE for each
quarter during the last two fiscal years.
Price Range
High Low
2013:
Fourth Quarter .................................... $119.44 $89.49
Third Quarter ..................................... 113.13 78.51
Second Quarter .................................... 89.91 65.01
First Quarter ..................................... 70.22 53.00
2012:
Fourth Quarter .................................... $ 58.04 $48.14
Third Quarter ..................................... 53.73 32.49
Second Quarter .................................... 33.79 23.47
First Quarter ..................................... 25.17 17.38
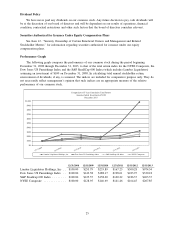
Issuer Purchases of Equity Securities
The following table presents our share repurchase activity for the quarter ended December 31, 2013
(dollars in thousands, except per share amounts):
Period
Total
Number of
Shares
Purchased
Average
Price Paid
per Share
Total
Number of
Shares
Purchased as
Part of
Publicly
Announced
Plans or
Programs
(2)
Maximum
Dollar Value
that May Yet
Be Purchased
Under the
Plans or
Programs
(2)
October 1, 2013 to October 31, 2013 . . . 23,000 $108.07 23,000 $24,461
November 1, 2013 to November 30,
2013
(1)
..................... 27,296 114.43 26,100 21,480
December 1, 2013 to December 31,
2013 ....................... 48,100 95.93 48,100 16,866
Total ........................ 98,396 $103.90 97,200 $16,866
(1)
Includes 1,196 shares of our common stock repurchased at an aggregate cost of $143 thousand, or an
average purchase price of $119.78 per share, in connection with the net settlement of shares issued as a
result of the vesting of restricted stock during the quarter ended December 31, 2013.
(2)
Except as noted in footnote 1 above, all of the above repurchases were made on the open market at
prevailing market rates plus related expenses under our stock repurchase programs. Our initial stock
repurchase program, which authorized the repurchase of up to $50 million in common stock, was
authorized by our board of directors and publicly announced on February 22, 2012. Our board of
directors subsequently authorized two additional stock repurchase programs, authorizing the repurchase of
up to an additional $50 million in common stock each. These programs have been publicly announced on
November 15, 2012 and February 19, 2014, respectively.
24