Lumber Liquidators 2013 Annual Report Download - page 53
Download and view the complete annual report
Please find page 53 of the 2013 Lumber Liquidators annual report below. You can navigate through the pages in the report by either clicking on the pages listed below, or by using the keyword search tool below to find specific information within the annual report.-
 1
1 -
2
-
3
-
4
-
5
-
6
-
7
-
8
-
9
-
10
-
11
-
12
-
13
-
14
-
15
-
16
-
17
-
18
-
19
-
20
-
21
-
22
-
23
-
24
-
25
-
26
-
27
-
28
-
29
-
30
-
31
-
32
-
33
-
34
-
35
-
36
-
37
-
38
-
39
-
40
-
41
-
42
-
 43
43 -
 44
44 -
 45
45 -
 46
46 -
 47
47 -
 48
48 -
 49
49 -
 50
50 -
 51
51 -
 52
52 -
 53
53 -
 54
54 -
 55
55 -
 56
56 -
 57
57 -
 58
58 -
 59
59 -
 60
60 -
 61
61 -
 62
62 -
 63
63 -
64
-
65
-
66
-
67
-
68
-
69
-
70
-
71
-
72
-
73
-
74
-
75
-
76
-
77
-
78
-
79
-
80
 |
 |

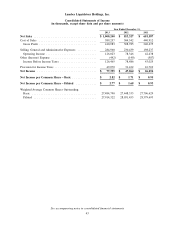
Lumber Liquidators Holdings, Inc.
Consolidated Statements of Income
(in thousands, except share data and per share amounts)
Year Ended December 31,
2013 2012 2011
Net Sales .................................... $ 1,000,240 $ 813,327 $ 681,587
Cost of Sales ................................. 589,257 504,542 440,912
Gross Profit ................................. 410,983 308,785 240,675
Selling, General and Administrative Expenses ........... 284,960 230,439 198,237
Operating Income ............................. 126,023 78,346 42,438
Other (Income) Expense .......................... (442) (140) (587)
Income Before Income Taxes ..................... 126,465 78,486 43,025
Provision for Income Taxes ........................ 49,070 31,422 16,769
Net Income .................................. $ 77,395 $ 47,064 $ 26,256
Net Income per Common Share − Basic .............. $ 2.82 $ 1.71 $ 0.95
Net Income per Common Share − Diluted ............ $ 2.77 $ 1.68 $ 0.93
Weighted Average Common Shares Outstanding:
Basic ..................................... 27,484,790 27,448,333 27,706,629
Diluted .................................... 27,914,322 28,031,453 28,379,693
See accompanying notes to consolidated financial statements
43