Lumber Liquidators 2013 Annual Report Download - page 36
Download and view the complete annual report
Please find page 36 of the 2013 Lumber Liquidators annual report below. You can navigate through the pages in the report by either clicking on the pages listed below, or by using the keyword search tool below to find specific information within the annual report.-
 1
1 -
2
-
3
-
4
-
5
-
6
-
7
-
8
-
9
-
10
-
11
-
12
-
13
-
14
-
15
-
16
-
17
-
18
-
19
-
20
-
21
-
22
-
23
-
24
-
25
-
 26
26 -
 27
27 -
 28
28 -
 29
29 -
 30
30 -
 31
31 -
 32
32 -
 33
33 -
 34
34 -
 35
35 -
 36
36 -
 37
37 -
 38
38 -
 39
39 -
 40
40 -
 41
41 -
 42
42 -
 43
43 -
 44
44 -
 45
45 -
 46
46 -
47
-
48
-
49
-
50
-
51
-
52
-
53
-
54
-
55
-
56
-
57
-
58
-
59
-
60
-
61
-
62
-
63
-
64
-
65
-
66
-
67
-
68
-
69
-
70
-
71
-
72
-
73
-
74
-
75
-
76
-
77
-
78
-
79
-
80
 |
 |

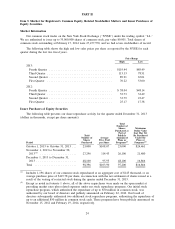
Item 6. Selected Financial Data.
The selected statements of income data for the years ended December 31, 2013, 2012 and 2011 and the
balance sheet data as of December 31, 2013 and 2012 have been derived from our audited consolidated
financial statements included in Item 8. ‘‘Consolidated Financial Statements and Supplementary Data’’ of this
report. This information should be read in conjunction with those audited financial statements, the notes
thereto, and Item 7. ‘‘Management’s Discussion and Analysis of Financial Condition and Results of
Operations’’ of this report.
We reorganized effective December 31, 2009 to create a new holding company structure. As a result, a
new parent company named Lumber Liquidators Holdings, Inc. was formed. Outstanding shares of the
common stock of the former parent company, which was named Lumber Liquidators, Inc., were automatically
converted, on a share for share basis, into identical shares of common stock of the new holding company. We
operate as a single segment.
The selected balance sheet data set forth below as of December 31, 2011, 2010 and 2009, and income
data for the years ended December 31, 2010 and 2009 are derived from our audited consolidated financial
statements contained in reports previously filed with the SEC, which are not included herein. Our historical
results are not necessarily indicative of our results for any future period.
Year Ended December 31,
2013 2012 2011 2010 2009
(dollars in thousands, except per share amounts)
Statement of Income Data
Net sales ................... $ 1,000,240 $ 813,327 $ 681,587 $ 620,281 $ 544,568
Comparable store net sales
increase (decrease)
(1)
....... 15.8% 11.4% (2.0)% 2.1% 0.0%
Cost of sales ................ 589,257 504,542 440,912 404,451 349,891
Gross profit ................. 410,983 308,785 240,675 215,830 194,677
Selling, general and administrative
expenses .................. 284,960 230,439 198,237 173,667 151,070
Operating income ............. 126,023 78,346 42,438 42,163 43,607
Interest expense .............. ———— 2
Other (income) expense
(2)
....... (442) (140) (587) (579) (500)
Income before income taxes ...... 126,465 78,486 43,025 42,742 44,105
Provision for income taxes ....... 49,070 31,422 16,769 16,476 17,181
Net income ................. $ 77,395 $ 47,064 $ 26,256 $ 26,266 $ 26,924
Net income per common share:
Basic .................... $ 2.82 $ 1.71 $ 0.95 $ 0.96 $ 1.00
Diluted ................... $ 2.77 $ 1.68 $ 0.93 $ 0.93 $ 0.97
Weighted average common shares
outstanding:
Basic .................... 27,484,790 27,448,333 27,706,629 27,384,095 26,983,689
Diluted ................... 27,914,322 28,031,453 28,379,693 28,246,453 27,684,547
(1)
A store is generally considered comparable on the first day of the thirteenth full calendar month after
opening.
(2)
Includes interest income.
26