Lumber Liquidators 2013 Annual Report Download - page 43
Download and view the complete annual report
Please find page 43 of the 2013 Lumber Liquidators annual report below. You can navigate through the pages in the report by either clicking on the pages listed below, or by using the keyword search tool below to find specific information within the annual report.-
 1
1 -
2
-
3
-
4
-
5
-
6
-
7
-
8
-
9
-
10
-
11
-
12
-
13
-
14
-
15
-
16
-
17
-
18
-
19
-
20
-
21
-
22
-
23
-
24
-
25
-
26
-
27
-
28
-
29
-
30
-
31
-
32
-
 33
33 -
 34
34 -
 35
35 -
 36
36 -
 37
37 -
 38
38 -
 39
39 -
 40
40 -
 41
41 -
 42
42 -
 43
43 -
 44
44 -
 45
45 -
 46
46 -
 47
47 -
 48
48 -
 49
49 -
 50
50 -
 51
51 -
 52
52 -
 53
53 -
54
-
55
-
56
-
57
-
58
-
59
-
60
-
61
-
62
-
63
-
64
-
65
-
66
-
67
-
68
-
69
-
70
-
71
-
72
-
73
-
74
-
75
-
76
-
77
-
78
-
79
-
80
 |
 |

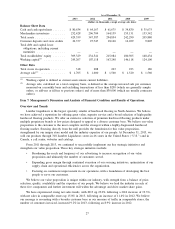
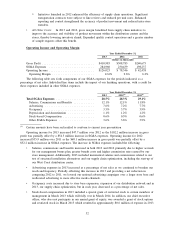
• Other SG&A expenses in 2013 included incremental legal and professional fees of approximately
$1.5 million, approximately $0.5 million of costs related to the start-up of our West Coast
distribution center and costs of certain programs under development, including international
operations and our installation test. In 2012, other SG&A expenses decreased as a percentage of net
sales primarily due to higher net sales and increased reimbursements from our primary installation
partner, partially offset by higher bankcard discount rates related to certain extended-term
promotional programs and approximately $0.5 million related to the resolution of a 2012 legal
matter.
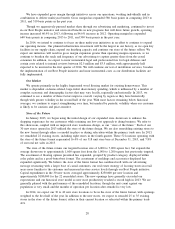
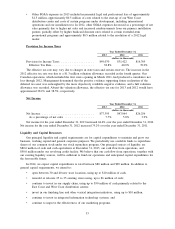
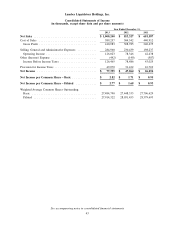
Provision for Income Taxes
Year Ended December 31,
2013 2012 2011
(dollars in thousands)
Provision for Income Taxes ................... $49,070 $31,422 $16,769
Effective Tax Rate ........................ 38.8% 40.0% 39.0%
The effective tax rate may vary due to changes in state taxes and certain reserves. The increase in the
2012 effective tax rate was due to a $1.3 million valuation allowance recorded in the fourth quarter. Our
Canadian operations, which included the first stores opening in March 2011, had produced a cumulative net
loss through 2012. Management determined that the positive evidence supporting future realization of the
deferred tax asset was outweighed by the more objectively verifiable negative evidence, and a full valuation
allowance was recorded. Absent the valuation allowance, the effective tax rate for 2013 and 2012 would have
approximated 38.2% and 38.5%, respectively.
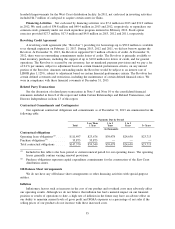
Net Income
Year Ended December 31,
2013 2012 2011
(dollars in thousands)
Net Income .............................. $77,395 $47,064 $26,256
As a percentage of net sales ................. 7.7% 5.8% 3.9%
Net income for the year ended December 31, 2013 increased 64.4% over the year ended December 31, 2012.
Net income for the year ended December 31, 2012 increased 79.2% over the year ended December 31, 2011.
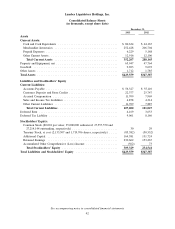
Liquidity and Capital Resources
Our principal liquidity and capital requirements are for capital expenditures to maintain and grow our
business, working capital and general corporate purposes. We periodically use available funds to repurchase
shares of our common stock under our stock repurchase program. Our principal sources of liquidity are
$80.6 million of cash and cash equivalents at December 31, 2013, our cash flow from operations, and
$50.0 million under our revolving credit facility. We believe that our cash flow from operations, together with
our existing liquidity sources, will be sufficient to fund our operations and anticipated capital expenditures for
the foreseeable future.
In 2014, we expect capital expenditures to total between $80 million and $90 million. In addition to
general capital requirements, we intend to:
• open between 30 and 40 new store locations, using up to $10 million of cash;
• remodel or relocate 25 to 35 existing stores using, up to $6 million of cash;
• continue to invest in our supply chain, using up to $50 million of cash primarily related to the
East Coast and West Coast distribution centers;
• invest in our finishing line and other vertical integration initiatives, using up to $10 million;
• continue to invest in integrated information technology systems; and
• continue to improve the effectiveness of our marketing programs.
33