Lumber Liquidators 2013 Annual Report Download - page 40
Download and view the complete annual report
Please find page 40 of the 2013 Lumber Liquidators annual report below. You can navigate through the pages in the report by either clicking on the pages listed below, or by using the keyword search tool below to find specific information within the annual report.-
 1
1 -
2
-
3
-
4
-
5
-
6
-
7
-
8
-
9
-
10
-
11
-
12
-
13
-
14
-
15
-
16
-
17
-
18
-
19
-
20
-
21
-
22
-
23
-
24
-
25
-
26
-
27
-
28
-
29
-
 30
30 -
 31
31 -
 32
32 -
 33
33 -
 34
34 -
 35
35 -
 36
36 -
 37
37 -
 38
38 -
 39
39 -
 40
40 -
 41
41 -
 42
42 -
 43
43 -
 44
44 -
 45
45 -
 46
46 -
 47
47 -
 48
48 -
 49
49 -
 50
50 -
51
-
52
-
53
-
54
-
55
-
56
-
57
-
58
-
59
-
60
-
61
-
62
-
63
-
64
-
65
-
66
-
67
-
68
-
69
-
70
-
71
-
72
-
73
-
74
-
75
-
76
-
77
-
78
-
79
-
80
 |
 |

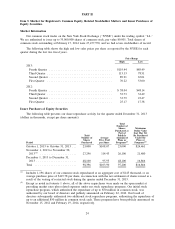
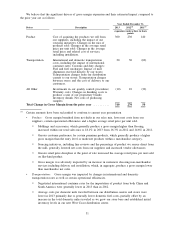
(1)
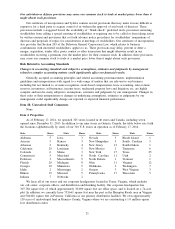
Average sale, calculated on a total company basis, is defined as the average invoiced sale per customer,
measured on a monthly basis and excluding transactions of less than $250 (which are generally sample
orders, or add-ons or fill-ins to previous orders) and of more than $30,000 (which are usually contractor
orders)
(2)
Average retail price per unit sold is calculated on a total company basis and excludes non-merchandise
revenue
(3)
A store is generally considered comparable on the first day of the thirteenth full calendar month after
opening
(4)
Change in number of customers invoiced which is calculated by applying our average sale to total net
sales at comparable stores
(5)
A cannibalized market has at least one comparable store and one non-comparable store
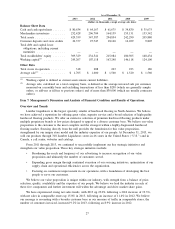
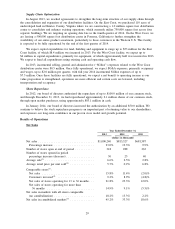
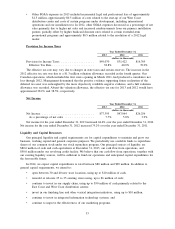
Net sales for 2013 increased $186.9 million, or 23.0%, over 2012 as net sales in comparable stores
increased $128.2 million and net sales in non-comparable stores increased $58.7 million. Net sales for 2012
increased $131.7 million, or 19.3%, over 2011 as net sales in comparable stores increased $77.2 million and
net sales in non-comparable stores increased $54.5 million.
Net sales in comparable stores increased 15.8% comparing 2013 to 2012 with an increase of 9.2%
attributable to the increase in the number of customers invoiced and an increase of 6.6% in the average sale.
Net sales in comparable stores increased 11.4% comparing 2012 to 2011 with an increase of 8.9% attributable
to the increase in the number of customers invoiced and an increase of 2.5% in the average sale. Net sales at
comparable stores increased primarily due to the following factors:
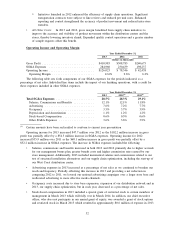
• We believe the number of customers invoiced in comparable stores has benefited from greater
recognition of our value proposition due to our efforts to expand our advertising reach and
frequency.
• We believe the average sale benefited from increases in the average retail price per unit sold due
primarily to changes in the sales mix of flooring products, stronger retail price discipline at the point
of sale and increases in the sales mix of moldings and accessories. Moldings and accessories
generally increase both the volume of units sold and the average retail price per unit sold.
• We believe net sales at comparable stores in 2013 were positively impacted by 40 to 50 basis points
due to the seven store locations serving communities recovering from the effects of Hurricane
Sandy, and as a result, experiencing increases in net sales greater than average.
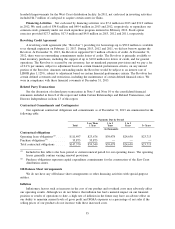
We expanded our store base unit count by 10.4%, 9.5% and 17.9% in 2013, 2012 and 2011, respectively,
with 25, 17 and 20 locations, respectively, opened in existing markets where brand awareness tends to
increase first year net sales per unit relative to a new market.
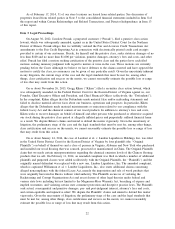
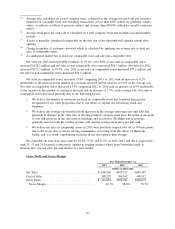
Gross Profit and Gross Margin
Year Ended December 31,
2013 2012 2011
(dollars in thousands)
Net Sales ............................... $1,000,240 $813,327 $681,587
Cost of Sales ............................. 589,257 504,542 440,912
Gross Profit .............................. $ 410,983 $308,785 $240,675
Gross Margin ........................... 41.1% 38.0% 35.3%
30