Lumber Liquidators 2013 Annual Report Download - page 38
Download and view the complete annual report
Please find page 38 of the 2013 Lumber Liquidators annual report below. You can navigate through the pages in the report by either clicking on the pages listed below, or by using the keyword search tool below to find specific information within the annual report.-
 1
1 -
2
-
3
-
4
-
5
-
6
-
7
-
8
-
9
-
10
-
11
-
12
-
13
-
14
-
15
-
16
-
17
-
18
-
19
-
20
-
21
-
22
-
23
-
24
-
25
-
26
-
27
-
 28
28 -
 29
29 -
 30
30 -
 31
31 -
 32
32 -
 33
33 -
 34
34 -
 35
35 -
 36
36 -
 37
37 -
 38
38 -
 39
39 -
 40
40 -
 41
41 -
 42
42 -
 43
43 -
 44
44 -
 45
45 -
 46
46 -
 47
47 -
 48
48 -
49
-
50
-
51
-
52
-
53
-
54
-
55
-
56
-
57
-
58
-
59
-
60
-
61
-
62
-
63
-
64
-
65
-
66
-
67
-
68
-
69
-
70
-
71
-
72
-
73
-
74
-
75
-
76
-
77
-
78
-
79
-
80
 |
 |
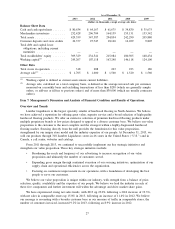
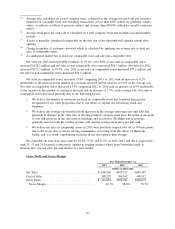
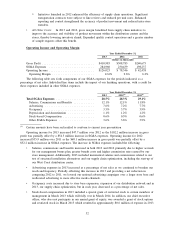
We have expanded gross margin through initiatives across our operations, working individually and in
combination to deliver multi-year benefit. Gross margin has expanded 580 basis points in comparing 2013 to
2011, and 310 basis points in the past year.
Though we aggressively pursued market share through our advertising and marketing, continued to invest
in our Best People initiative and reinvested benefits in new programs that will drive future growth, operating
income increased 60.9% in 2013, following an 84.6% increase in 2012. Operating margin has expanded
640 basis points in comparing 2013 to 2011, and 300 basis points in the past year.
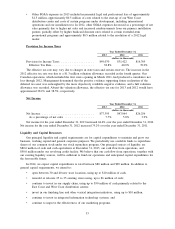
In 2014, we intend to continue to focus on these multi-year initiatives in an effort to continue to expand
our operating income. Our planned infrastructure investment will be the largest in our history, as we open key
facilities in our supply chain, expand our finishing capacity and continue our store of the future rollout. We
expect our initiatives will result in gross margin expansion greater than operating margin expansion, as we
continue to broaden the reach and frequency of our advertising to capture greater share from the casual
consumer. In addition, we expect to incur incremental legal and professional fees for legal defenses and
certain costs related to internal reviews between $2.5 million and $3.5 million, with approximately half
expected to be incurred in the first quarter of 2014. We will continue our test of installation services, broaden
the implementation of our Best People initiative and incur incremental costs as our distribution facilities are
fully implemented.
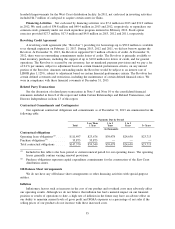
Our Market
We operate primarily in the highly fragmented wood flooring market for existing homeowners. This
market is dependent on home-related, large-ticket discretionary spending, which is influenced by a number of
complex economic and demographic factors that may vary locally, regionally and nationally. In 2013, we
continued to see a number of these factors improve overall, varying by region as they have historically,
though with greater volatility in the second half of the year. With most factors remaining below historical
averages, we continue to expect strengthening over time, but marked by periodic volatility when our customer
is likely to be cautious and price-sensitive.
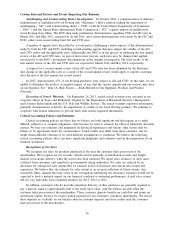
Store of the Future
In January 2013, we began using the initial design of our expanded store showroom to enhance the
shopping experience for our customers while retaining our low-cost approach to doing business. We refer to
this showroom, coupled with an improved store warehouse design, as our ‘‘store of the future.’’ Each of our
30 new stores opened in 2013 utilized the store of the future design. We are also remodeling existing stores to
the new format through either a remodel in place or during relocation within the primary trade area. In 2013,
we remodeled 22 existing stores, including eight stores in the fourth quarter. These 52 locations operating with
the store of the future format represented 16.4% of our 318 unit store base at December 31, 2013, and 7.8%
of our total net sales in 2013.
The store of the future retains our targeted location size of 6,000 to 7,000 square feet, but expands the
average showroom to approximately 1,600 square feet from the 1,000 to 1,200 square feet previously targeted.
The assortment of flooring options presented has expanded, grouped by product category, displayed within
color palate and in a good-better-best format. The assortment of moldings and accessories displayed has
expanded significantly. We believe the store of the future format has combined well with our advertising
message resonating with a larger base of casual customers, our real estate strategy of locating stores in retail
areas more familiar to the customer and increased in-store service levels through our Best People initiative.
Capital expenditures in the 30 new stores averaged approximately $250,000 per new location and
approximately $180,000 for the 22 remodeled stores. The new openings have generally exceeded our
expectations and our historical store model as new store productivity reached a record high in 2013. We are
generally pleased with the performance of the remodeled locations, though the unit count against our
population is very small and the months of operation per location after remodel is very low.
In 2014, we expect our 30 to 40 new store locations to be in the store of the future format, with openings
weighted to the first half of the year. In addition to the new stores, we expect to remodel 25 to 35 existing
stores in the store of the future format, either in their current location or relocated within the primary trade
area.
28