Lumber Liquidators 2011 Annual Report Download - page 64
Download and view the complete annual report
Please find page 64 of the 2011 Lumber Liquidators annual report below. You can navigate through the pages in the report by either clicking on the pages listed below, or by using the keyword search tool below to find specific information within the annual report.-
 1
1 -
2
-
3
-
4
-
5
-
6
-
7
-
8
-
9
-
10
-
11
-
12
-
13
-
14
-
15
-
16
-
17
-
18
-
19
-
20
-
21
-
22
-
23
-
24
-
25
-
26
-
27
-
28
-
29
-
30
-
31
-
32
-
33
-
34
-
35
-
36
-
37
-
38
-
39
-
40
-
41
-
42
-
43
-
44
-
45
-
46
-
47
-
48
-
49
-
50
-
51
-
52
-
53
-
 54
54 -
 55
55 -
 56
56 -
 57
57 -
 58
58 -
 59
59 -
 60
60 -
 61
61 -
 62
62 -
 63
63 -
 64
64 -
 65
65 -
 66
66 -
 67
67 -
 68
68 -
 69
69 -
 70
70 -
 71
71 -
 72
72 -
 73
73
 |
 |

Lumber Liquidators Holdings, Inc.
Notes to Consolidated Financial Statements—(Continued)
(amounts in thousands, except share data and per share amounts)
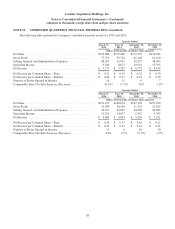
NOTE 13. CONDENSED QUARTERLY FINANCIAL INFORMATION (unaudited)
The following tables present the Company’s unaudited quarterly results for 2011 and 2010.
Quarter Ended
March 31,
2011
June 30,
2011
September 30,
2011
December 31,
2011
(dollars in thousands, except per share amounts)
Net Sales ............................................... $159,680 $175,460 $171,993 $174,454
Gross Profit ............................................ 57,793 59,724 61,248 61,910
Selling, General and Administrative Expenses ................. 48,453 51,051 50,327 48,405
Operating Income ........................................ 9,340 8,673 10,921 13,505
Net Income ............................................. $ 5,777 $ 5,287 $ 6,735 $ 8,458
Net Income per Common Share—Basic ...................... $ 0.21 $ 0.19 $ 0.24 $ 0.30
Net Income per Common Share—Diluted ..................... $ 0.20 $ 0.19 $ 0.24 $ 0.30
Number of Stores Opened in Quarter ......................... 16 11 6 7
Comparable Store Net Sales Increase (Decrease) ............... (4.3%) (7.9%) 3.0% 1.9%
Quarter Ended
March 31,
2010
June 30,
2010
September 30,
2010
December 31,
2010
(dollars in thousands, except per share amounts)
Net Sales ............................................... $151,195 $168,674 $147,192 $153,220
Gross Profit ............................................ 53,504 58,540 51,761 52,025
Selling, General and Administrative Expenses ................. 42,213 43,863 44,909 42,682
Operating Income ........................................ 11,291 14,677 6,852 9,343
Net Income ............................................. $ 6,968 $ 9,093 $ 4,284 $ 5,921
Net Income per Common Share—Basic ...................... $ 0.26 $ 0.33 $ 0.16 $ 0.22
Net Income per Common Share—Diluted ..................... $ 0.25 $ 0.32 $ 0.15 $ 0.21
Number of Stores Opened in Quarter ......................... 11 6 10 10
Comparable Store Net Sales Increase (Decrease) ............... 8.0% 5.5% (5.7%) 1.2%
58