Lumber Liquidators 2011 Annual Report Download - page 33
Download and view the complete annual report
Please find page 33 of the 2011 Lumber Liquidators annual report below. You can navigate through the pages in the report by either clicking on the pages listed below, or by using the keyword search tool below to find specific information within the annual report.-
 1
1 -
2
-
3
-
4
-
5
-
6
-
7
-
8
-
9
-
10
-
11
-
12
-
13
-
14
-
15
-
16
-
17
-
18
-
19
-
20
-
21
-
22
-
 23
23 -
 24
24 -
 25
25 -
 26
26 -
 27
27 -
 28
28 -
 29
29 -
 30
30 -
 31
31 -
 32
32 -
 33
33 -
 34
34 -
 35
35 -
 36
36 -
 37
37 -
 38
38 -
 39
39 -
 40
40 -
 41
41 -
 42
42 -
 43
43 -
44
-
45
-
46
-
47
-
48
-
49
-
50
-
51
-
52
-
53
-
54
-
55
-
56
-
57
-
58
-
59
-
60
-
61
-
62
-
63
-
64
-
65
-
66
-
67
-
68
-
69
-
70
-
71
-
72
-
73
 |
 |

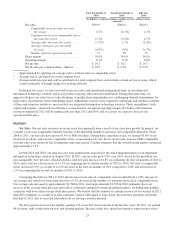
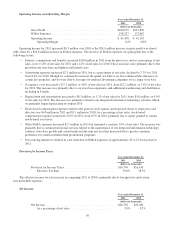
The estimated expansion (contraction) of our gross margin from the prior year, by key driver, is as follows:
Year ended December 31,
2011 2010 2009
(in basis points)
Cost of Product ................................................... 150 — (50)
Transportation .................................................... (60) (80) 120
All Other ........................................................ (40) (5) 20
Impact of Integrated Information Technology Solution Implementation ....... — (10) —
Total Change in Gross Margin from the prior year .................... 50 (95) 90
Within our cost of product in 2011, gross margin benefited from net sales mix shifts, including increased sales of
moldings and accessories and a broadened assortment of engineered hardwoods, and the initial implementation of our
sourcing initiatives as described below. Partially offsetting these benefits, additional promotions were required to call a price
sensitive customer to action.
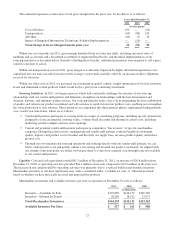
Within our transportation costs in 2011, gross margin was adversely impacted by higher inbound transportation costs
capitalized into our unit cost and an increase in the average cost per mile, partially offset by an increase in direct shipments
received by our stores.
Within our other costs in 2011, we increased our investment in quality control, sought optimization of in-store inventory
levels and eliminated certain products which would not be a part of our continuing assortment.
Sourcing Initiatives. In 2011, we began a process which will continually challenge the structure of our sourcing
relationships with our vendor-mill partners and ultimately strengthen our relationships with the best international and
domestic partners, and eliminate weaker sources. Our sourcing initiatives play a key role in maintaining the best combination
of quality and value in our product assortment and will continue to result in lower net product costs, enabling us to strengthen
the value proposition to our customer. These initiatives are segregated into three primary phases, implemented independently
over a multi-year time frame, which are as follows:
OVendor-mill partners participate to varying levels in a range of continuing programs, including specific promotions
designed to create incremental customer traffic, volume based discounts and sharing of certain costs, including
marketing, product samples and new store openings.
OCurrent and potential vendor-mill partners participate in competitive “line reviews” of specific merchandise
categories. During these line reviews, management and vendor-mill partners evaluate breadth of assortment,
quality, logistics and product cost to broaden and diversify our supply base, increase product quality and reduce
product cost.
OThrough our own international sourcing operations and working directly with our vendor-mill partners, we can
better control product cost and quality, enhance forecasting and broaden our product assortment. As aligned with
our strategic long-term goals, we utilize our balance sheet to control raw material costs through scale not available
to our vendor-mill partners.
Liquidity. Cash and cash equivalents totaled $61.7 million at December 31, 2011, an increase of $26.8 million from
December 31, 2010, as operating activities provided $44.1 million of net cash compared to $17.0 million in the prior year.
The increase in net cash provided by operating activities was primarily due to a reduced build in merchandise inventory.
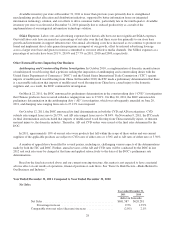
Merchandise inventory is our most significant asset, and is considered either “available for sale” or “inbound in-transit,”
based on whether we have physically received and inspected the products.
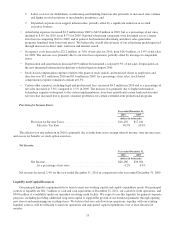
Merchandise inventories and available inventory per store in operation on December 31 were as follows:
2011 2010 2009
(in thousands)
Inventory—Available for Sale ............................ $135,850 $136,179 $109,369
Inventory—Inbound In-Transit ............................ 28,289 18,952 23,973
Total Merchandise Inventories .......................... $164,139 $155,131 $133,342
Available Inventory Per Store ........................... $ 517 $ 611 $ 588
27