Lumber Liquidators 2011 Annual Report Download - page 39
Download and view the complete annual report
Please find page 39 of the 2011 Lumber Liquidators annual report below. You can navigate through the pages in the report by either clicking on the pages listed below, or by using the keyword search tool below to find specific information within the annual report.-
 1
1 -
2
-
3
-
4
-
5
-
6
-
7
-
8
-
9
-
10
-
11
-
12
-
13
-
14
-
15
-
16
-
17
-
18
-
19
-
20
-
21
-
22
-
23
-
24
-
25
-
26
-
27
-
28
-
 29
29 -
 30
30 -
 31
31 -
 32
32 -
 33
33 -
 34
34 -
 35
35 -
 36
36 -
 37
37 -
 38
38 -
 39
39 -
 40
40 -
 41
41 -
 42
42 -
 43
43 -
 44
44 -
 45
45 -
 46
46 -
 47
47 -
 48
48 -
 49
49 -
50
-
51
-
52
-
53
-
54
-
55
-
56
-
57
-
58
-
59
-
60
-
61
-
62
-
63
-
64
-
65
-
66
-
67
-
68
-
69
-
70
-
71
-
72
-
73
 |
 |

OLabor costs for our distribution, warehousing and finishing functions due primarily to increased sales volume
and higher in-stock positions of merchandise inventories; and
OExpanded corporate store-support infrastructure, partially offset by a significant reduction in accrued
executive bonuses.
• Advertising expenses increased $2.5 million from 2009 to $49.8 million in 2010, but as a percentage of net sales,
declined to 8.0% for 2010, from 8.7% for 2009. National advertising campaigns were leveraged across a larger
store base in comparing 2010 to 2009, and in general, both national advertising and direct sales generation
programs benefited from lower unit prices. We believe the overall effectiveness of our advertising spend improved
through increases in direct mail, television and internet search.
• Occupancy costs increased to $22.2 million, or 3.6% of net sales for 2010, from $18.4 million, or 3.4% of net sales
for 2009. The increase was primarily due to our store base expansion, partially offset by leverage at comparable
stores.
• Depreciation and amortization increased $0.9 million but remained a constant 0.9% of net sales. Depreciation on
the new integrated information technology solution began in August 2010.
• Stock-based compensation expense related to the grant of stock options and restricted shares to employees and
directors was $3.1 million in 2010 and $3.0 million in 2009. As a percentage of net sales, stock-based
compensation expense remained constant at 0.5%.
• Certain other expenses, including legal and professional fees, increased $4.5 million in 2010 and as a percentage of
net sales increased to 3.8% compared to 3.5% in 2009. The increase was primarily due to higher information
technology expenses subsequent to the system implementation, store-base growth and certain bankcard discount
rate fees that increased due to greater consumer preference for certain extended-term promotional programs.
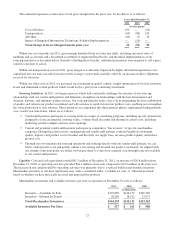
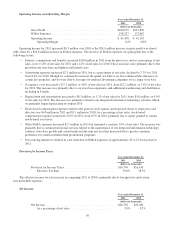
Provision for Income Taxes.
Year ended December 31,
2010 2009
(dollars in thousands)
Provision for Income Taxes ................................. $16,476 $17,181
Effective Tax Rate .................................... 38.5% 39.0%
The effective tax rate reduction in 2010 is primarily due to reductions in tax-exempt interest income, state income taxes
and excess tax benefits on stock option exercises.
Net Income.
Year ended December 31,
2010 2009
(dollars in thousands)
Net Income .............................................. $26,266 $26,924
As a percentage of net sales ............................. 4.2% 4.9%
Net income decreased 2.4% for the year ended December 31, 2010 in comparison to the year ended December 31, 2009.
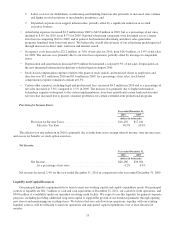
Liquidity and Capital Resources
Our principal liquidity requirements have been to meet our working capital and capital expenditure needs. Our principal
sources of liquidity are $61.7 million of cash and cash equivalents at December 31, 2011, our cash flow from operations, and
$50.0 million of availability under our amended revolving credit facility. We expect to use this liquidity for general corporate
purposes, including providing additional long-term capital to support the growth of our business (primarily through opening
new stores) and maintaining our existing stores. We believe that our cash flow from operations, together with our existing
liquidity sources, will be sufficient to fund our operations and anticipated capital expenditures over at least the next 24
months.
33