Lumber Liquidators 2011 Annual Report Download - page 5
Download and view the complete annual report
Please find page 5 of the 2011 Lumber Liquidators annual report below. You can navigate through the pages in the report by either clicking on the pages listed below, or by using the keyword search tool below to find specific information within the annual report.-
 1
1 -
 2
2 -
 3
3 -
 4
4 -
 5
5 -
 6
6 -
 7
7 -
 8
8 -
 9
9 -
 10
10 -
 11
11 -
 12
12 -
 13
13 -
 14
14 -
 15
15 -
 16
16 -
17
-
18
-
19
-
20
-
21
-
22
-
23
-
24
-
25
-
26
-
27
-
28
-
29
-
30
-
31
-
32
-
33
-
34
-
35
-
36
-
37
-
38
-
39
-
40
-
41
-
42
-
43
-
44
-
45
-
46
-
47
-
48
-
49
-
50
-
51
-
52
-
53
-
54
-
55
-
56
-
57
-
58
-
59
-
60
-
61
-
62
-
63
-
64
-
65
-
66
-
67
-
68
-
69
-
70
-
71
-
72
-
73
 |
 |
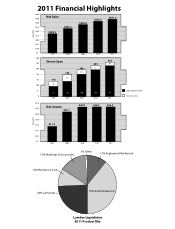
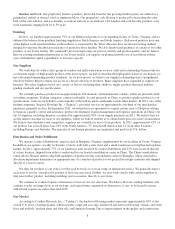
Net Sales
$225
$300
$375
$450
$525
$600
$700
$800
$150
$0
MILLIONS
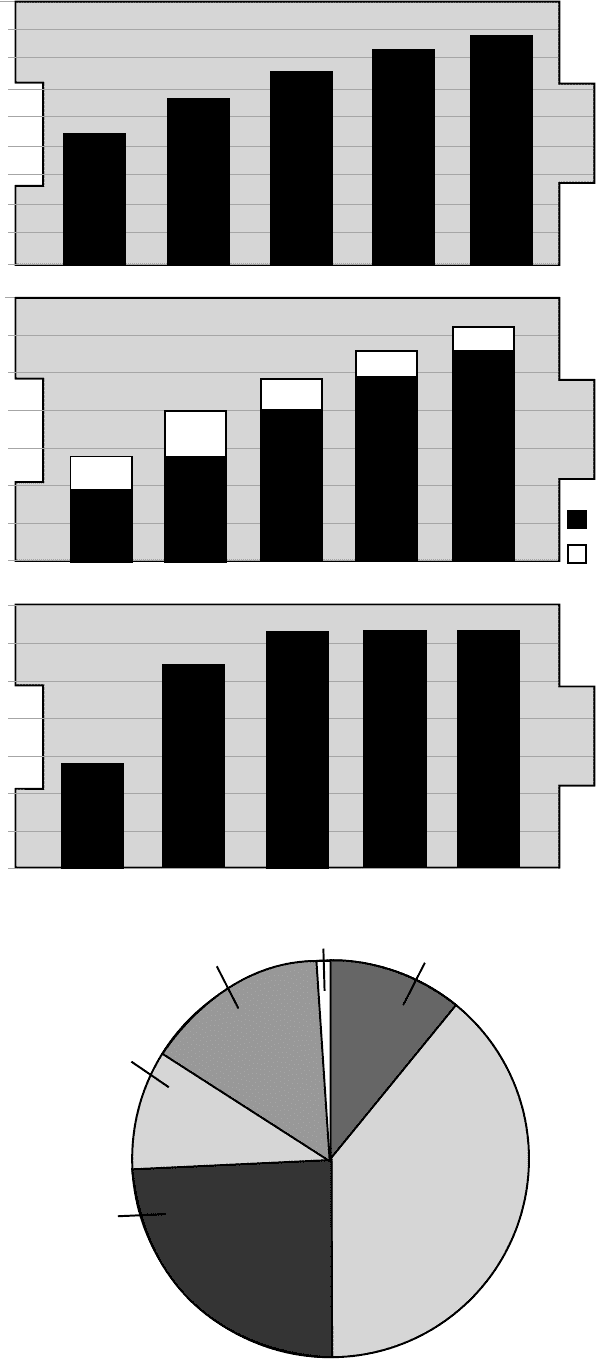
39% Solid Hardwood
24% Laminates
10% Bamboo & Cork
15% Moldings & Accessories
1% Other
Lumber Liquidators
2011 Product Mix
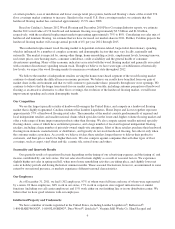
Net Income
2007
$11.3
$0
$4.0
$8.0
$12.0
$16.0
$20.0
$24.0
$28.0
MILLIONS
250
Beginning of the year
Net new stores
0
75
100
125
150
200
Stores Open
2007
25
91
116
2008
116
34
150
2011 Financial Highlights
2007
$405.3
2008
$22.1
2008
$482.2
2009
$544.6
300
2009
$26.9
2010
$620.3
2011
$681.6
2009
36
186
150
2010
186
223
37
2011
223
263
40
2010
$26.3
2011
$26.3
11% Engineered Hardwood