Lumber Liquidators 2011 Annual Report Download - page 30
Download and view the complete annual report
Please find page 30 of the 2011 Lumber Liquidators annual report below. You can navigate through the pages in the report by either clicking on the pages listed below, or by using the keyword search tool below to find specific information within the annual report.-
 1
1 -
2
-
3
-
4
-
5
-
6
-
7
-
8
-
9
-
10
-
11
-
12
-
13
-
14
-
15
-
16
-
17
-
18
-
19
-
 20
20 -
 21
21 -
 22
22 -
 23
23 -
 24
24 -
 25
25 -
 26
26 -
 27
27 -
 28
28 -
 29
29 -
 30
30 -
 31
31 -
 32
32 -
 33
33 -
 34
34 -
 35
35 -
 36
36 -
 37
37 -
 38
38 -
 39
39 -
 40
40 -
41
-
42
-
43
-
44
-
45
-
46
-
47
-
48
-
49
-
50
-
51
-
52
-
53
-
54
-
55
-
56
-
57
-
58
-
59
-
60
-
61
-
62
-
63
-
64
-
65
-
66
-
67
-
68
-
69
-
70
-
71
-
72
-
73
 |
 |

proprietary brands through complementary channels, including 263 store locations, our website, our catalog and a full-
service call center in Toano, Virginia. At December 31, 2011, we operated 256 store locations in 46 states and seven store
locations in Ontario, Canada. Our customer is primarily the existing homeowner, who we believe represents over 90% of our
customer count.
The wood flooring market for existing homeowners is dependent on home-related, large-ticket discretionary spending,
which is influenced by a number of complex economic and demographic factors that may vary locally, regionally and
nationally. Many of the economic indicators associated with the wood flooring market, and more generally associated with
consumer discretionary spending, remain weak. Though we believe we have seen signs of stabilization at historically low
levels, we expect the wood flooring market to remain in a weakened state throughout 2012. Further, we believe a number of
macroeconomic factors may result in volatile consumer demand for large-ticket, discretionary improvements to the home in
2012. As pressures challenging large-ticket purchasing decisions continue, we expect the consumer to remain cautious and
price sensitive, responding primarily to specific promotions and calls to action.
Our market is highly fragmented and includes both national and regional home improvement chains, smaller national
specialty flooring chains and a large number of local and regional independent flooring retailers, including a large number of
privately-owned single-site enterprises. We compete on the basis of price, quality, selection and availability of the wood
flooring that we offer our customers, as well as the level of customer service we can provide. We position ourselves as
hardwood flooring experts and believe our high level of customer service reflects this positioning. Substantially all of our
proprietary products are purchased directly from mills or associated brokers with whom we have cultivated relationships to
ensure a consistent supply of high-quality product at the lowest prices. We believe that our brands, value proposition and
integrated multi-channel approach are important competitive advantages. We believe the number of independent retailers
serving the homeowner-based segment of the wood flooring market will continue to decline, however, presenting us with an
opportunity for market share growth, primarily through store base expansion.
We believe there is a significant opportunity to expand our store base in both new and existing markets, domestic and
international. We expect store base growth will drive market productivity and operational efficiencies. We continue to invest
in the infrastructure supporting our store growth and operations. Our focus has been product assortment, in-stock inventory
position, international and domestic logistics and store management training. We expect to continue to focus in these areas.
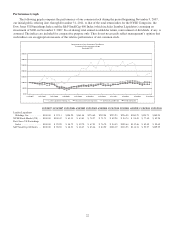
Our operations in 2010 and 2011 were impacted by the implementation of the initial phase of our integrated information
technology solution in August 2010. This implementation included an enhanced point-of-sale solution across our entire store
base, a warehouse management and inventory control system serving our entire distribution network, an integrated
merchandising and product allocation system, and certain related management reporting functionality. The implementation
reduced productivity in our store and warehouse operations. Though we believe our productivity was restored across our
operations by the end of the first quarter of 2011, we believe our inconsistent servicing of consumer demand adversely
impacted net sales through the first half of 2011. A comparison of our six-month results in 2011 and 2010, to the comparable
prior year period, were as follows:
First Six Months of
2011
Second Six Months of
2011
Full Year
2011
(in millions, except percentages, number of stores and per share
amounts)
Net sales ............................... $335.1 $346.5 $681.6
Comparable store net sales increase
(decrease) ....................... (6.2%) 2.5% (2.0%)
Customers invoiced at comparable stores1
decrease ......................... (8.6%) (0.3%) (4.7%)
Average sale2increase ................ 2.6% 2.8% 2.8%
Average retail price per unit sold3
increase ......................... 7.6% 5.2% 6.8%
Number of stores opened in period ...... 27 13 40
Gross margin ........................... 35.1% 35.6% 35.3%
Operating margin ........................ 5.4% 7.1% 6.2%
Net income ............................. $ 11.1 $ 15.2 $ 26.3
Net income per common share—diluted ...... $ 0.39 $ 0.54 $ 0.93
24