Lumber Liquidators 2011 Annual Report Download - page 28
Download and view the complete annual report
Please find page 28 of the 2011 Lumber Liquidators annual report below. You can navigate through the pages in the report by either clicking on the pages listed below, or by using the keyword search tool below to find specific information within the annual report.-
 1
1 -
2
-
3
-
4
-
5
-
6
-
7
-
8
-
9
-
10
-
11
-
12
-
13
-
14
-
15
-
16
-
17
-
 18
18 -
 19
19 -
 20
20 -
 21
21 -
 22
22 -
 23
23 -
 24
24 -
 25
25 -
 26
26 -
 27
27 -
 28
28 -
 29
29 -
 30
30 -
 31
31 -
 32
32 -
 33
33 -
 34
34 -
 35
35 -
 36
36 -
 37
37 -
 38
38 -
39
-
40
-
41
-
42
-
43
-
44
-
45
-
46
-
47
-
48
-
49
-
50
-
51
-
52
-
53
-
54
-
55
-
56
-
57
-
58
-
59
-
60
-
61
-
62
-
63
-
64
-
65
-
66
-
67
-
68
-
69
-
70
-
71
-
72
-
73
 |
 |
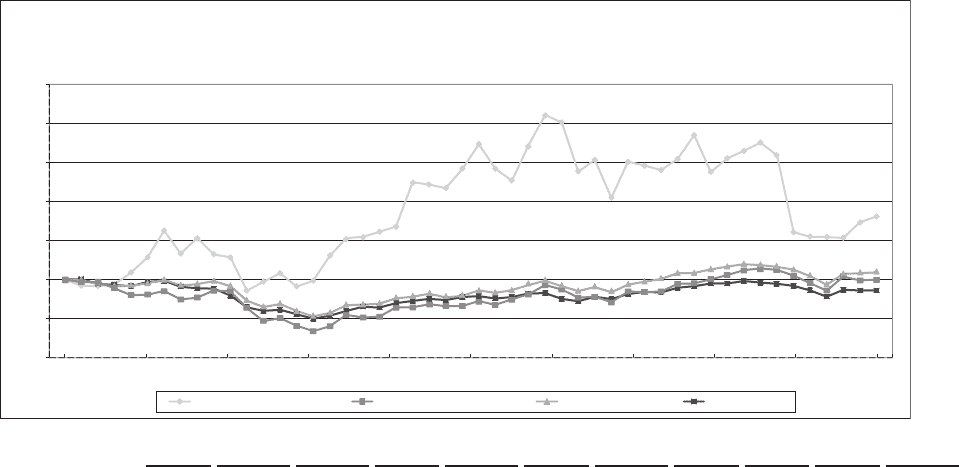
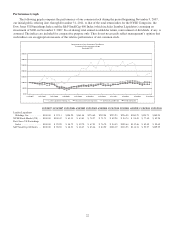
Performance Graph
The following graph compares the performance of our common stock during the period beginning November 9, 2007,
our initial public offering date, through December 31, 2011, to that of the total return index for the NYSE Composite, the
Dow Jones US Furnishings Index and the S&P SmallCap 600 Index (which includes Lumber Liquidators) assuming an
investment of $100 on November 9, 2007. In calculating total annual stockholder return, reinvestment of dividends, if any, is
assumed. The indices are included for comparative purpose only. They do not necessarily reflect management’s opinion that
such indices are an appropriate measure of the relative performance of our common stock.
0.00
50.00
100.00
150.00
200.00
250.00
300.00
350.00
11/9/2007
Comparison of 4 Year Cumulative Total Return
Assumes Initial Investment of $100
December 2011
Lumber Liquidators Holdings, Inc. Dow Jones US Furnishings Index S&P Smallcap 600 Index NYSE Composite
12/31/2007 12/31/2008 6/30/2009 12/31/2009 6/30/2010 12/31/201112/31/2010 6/30/20113/31/2011 9/30/2011
11/9/2007 12/31/2007 12/31/2008 6/30/2009 12/31/2009 6/30/2010 12/31/2010 3/31/2011 6/30/2011 9/30/2011 12/31/2011
Lumber Liquidators
Holdings, Inc. .......... $100.00 $ 92.11 $108.20 $161.48 $274.60 $239.04 $255.23 $256.05 $260.25 $154.71 $180.94
NYSE Stock Market.(US) . . $100.00 $100.42 $ 61.11 $ 63.83 $ 78.57 $ 71.71 $ 89.28 $ 94.74 $ 94.45 $ 77.60 $ 85.98
Dow Jones US Furnishings
Index ................. $100.00 $ 95.99 $ 48.75 $ 49.70 $ 67.93 $ 76.70 $ 94.45 $105.64 $112.46 $ 85.49 $ 99.69
S&P SmallCap 600 Index . . $100.00 $ 98.96 $ 68.21 $ 68.67 $ 85.66 $ 84.90 $108.19 $116.53 $116.34 $ 93.27 $109.29
22