Lumber Liquidators 2011 Annual Report Download - page 29
Download and view the complete annual report
Please find page 29 of the 2011 Lumber Liquidators annual report below. You can navigate through the pages in the report by either clicking on the pages listed below, or by using the keyword search tool below to find specific information within the annual report.-
 1
1 -
2
-
3
-
4
-
5
-
6
-
7
-
8
-
9
-
10
-
11
-
12
-
13
-
14
-
15
-
16
-
17
-
18
-
 19
19 -
 20
20 -
 21
21 -
 22
22 -
 23
23 -
 24
24 -
 25
25 -
 26
26 -
 27
27 -
 28
28 -
 29
29 -
 30
30 -
 31
31 -
 32
32 -
 33
33 -
 34
34 -
 35
35 -
 36
36 -
 37
37 -
 38
38 -
 39
39 -
40
-
41
-
42
-
43
-
44
-
45
-
46
-
47
-
48
-
49
-
50
-
51
-
52
-
53
-
54
-
55
-
56
-
57
-
58
-
59
-
60
-
61
-
62
-
63
-
64
-
65
-
66
-
67
-
68
-
69
-
70
-
71
-
72
-
73
 |
 |

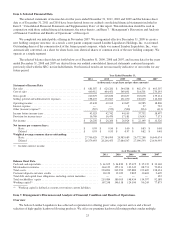
Item 6. Selected Financial Data.
The selected statements of income data for the years ended December 31, 2011, 2010 and 2009 and the balance sheet
data as of December 31, 2011 and 2010 have been derived from our audited consolidated financial statements included in
Item 8. “Consolidated Financial Statements and Supplementary Data” of this report. This information should be read in
conjunction with those audited financial statements, the notes thereto, and Item 7. “Management’s Discussion and Analysis
of Financial Condition and Results of Operations” of this report.
We completed our initial public offering in November 2007. We reorganized effective December 31, 2009 to create a
new holding company structure. As a result, a new parent company named Lumber Liquidators Holdings, Inc. was formed.
Outstanding shares of the common stock of the former parent company, which was named Lumber Liquidators, Inc., were
automatically converted, on a share for share basis, into identical shares of common stock of the new holding company. We
operate as a single segment.
The selected balance sheet data set forth below as of December 31, 2009, 2008 and 2007, and income data for the years
ended December 31, 2008 and 2007 are derived from our audited consolidated financial statements contained in reports
previously filed with the SEC, not included herein. Our historical results are not necessarily indicative of our results for any
future period.
Year Ended December 31,
2011 2010 2009 2008 2007
(in thousands, except share and per share amounts)
Statement of Income Data
Net sales ........................................... $ 681,587 $ 620,281 $ 544,568 $ 482,179 $ 405,307
Cost of sales ........................................ 440,912 404,451 349,891 314,501 270,193
Gross profit ......................................... 240,675 215,830 194,677 167,678 135,114
Selling, general and administrative expenses ............... 198,237 173,667 151,070 130,693 116,308
Operating income .................................... 42,438 42,163 43,607 36,985 18,806
Interest expense ..................................... — — 2 27 722
Other (income) expense(1) .............................. (587) (579) (500) (834) (413)
Income before income taxes ............................ 43,025 42,742 44,105 37,792 18,497
Provision for income taxes ............................. 16,769 16,476 17,181 15,643 7,171
Net income ......................................... $ 26,256 $ 26,266 $ 26,924 $ 22,149 $ 11,326
Net income per common share:
Basic .......................................... $ 0.95 $ 0.96 $ 1.00 $ 0.83 $ 0.68
Diluted ........................................ $ 0.93 $ 0.93 $ 0.97 $ 0.82 $ 0.48
Weighted average common shares outstanding:
Basic .......................................... 27,706,629 27,384,095 26,983,689 26,772,288 16,646,674
Diluted ........................................ 28,379,693 28,246,453 27,684,547 27,090,593 23,634,995
(1) Includes interest income.
As of December 31,
2011 2010 2009 2008 2007
(in thousands)
Balance Sheet Data
Cash and cash equivalents .......................................... $ 61,675 $ 34,830 $ 35,675 $ 35,139 $ 33,168
Merchandise inventories ........................................... 164,139 155,131 133,342 88,731 72,024
Total assets ...................................................... 294,854 242,290 205,880 152,405 128,424
Customer deposits and store credits .................................. 18,120 12,039 9,805 10,418 9,609
Total debt and capital lease obligations, including current maturities ........ ————122
Total stockholders’ equity .......................................... 215,084 180,505 148,434 114,397 92,188
Working capital(1) ................................................ 167,248 146,118 124,100 96,245 77,875
(1) Working capital is defined as current assets minus current liabilities.
Item 7. Management’s Discussion and Analysis of Financial Condition and Results of Operations.
Overview
We believe Lumber Liquidators has achieved a reputation for offering great value, superior service and a broad
selection of high-quality hardwood flooring products. We offer our premium hardwood flooring products under multiple
23