Lumber Liquidators 2011 Annual Report Download - page 36
Download and view the complete annual report
Please find page 36 of the 2011 Lumber Liquidators annual report below. You can navigate through the pages in the report by either clicking on the pages listed below, or by using the keyword search tool below to find specific information within the annual report.-
 1
1 -
2
-
3
-
4
-
5
-
6
-
7
-
8
-
9
-
10
-
11
-
12
-
13
-
14
-
15
-
16
-
17
-
18
-
19
-
20
-
21
-
22
-
23
-
24
-
25
-
 26
26 -
 27
27 -
 28
28 -
 29
29 -
 30
30 -
 31
31 -
 32
32 -
 33
33 -
 34
34 -
 35
35 -
 36
36 -
 37
37 -
 38
38 -
 39
39 -
 40
40 -
 41
41 -
 42
42 -
 43
43 -
 44
44 -
 45
45 -
 46
46 -
47
-
48
-
49
-
50
-
51
-
52
-
53
-
54
-
55
-
56
-
57
-
58
-
59
-
60
-
61
-
62
-
63
-
64
-
65
-
66
-
67
-
68
-
69
-
70
-
71
-
72
-
73
 |
 |

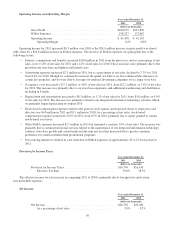
Operating Income and Operating Margin.
Year ended December 31,
2011 2010
(dollars in thousands)
Gross Profit .............................................. $240,675 $215,830
SG&A Expenses .......................................... 198,237 173,667
Operating Income ......................................... $ 42,438 $ 42,163
Operating Margin ..................................... 6.2% 6.8%
Operating income for 2011 increased $0.3 million over 2010 as the $24.9 million increase in gross profit was almost
fully offset by a $24.6 million increase in SG&A expenses. The increase in SG&A expenses was principally due to the
following factors:
• Salaries, commissions and benefits increased $10.8 million in 2011 from the prior year, and as a percentage of net
sales, were 11.8% of net sales for 2011 and 11.2% of net sales for 2010. These increases were primarily due to the
growth in our store base and higher total benefit costs.
• Advertising expenses increased $2.5 million in 2011, but as a percentage of net sales, declined to 7.7% for 2011,
from 8.0% for 2010. Though we continued to increase the spend, we believe we have enhanced the efficiency in
certain key programs, and we were able to leverage our national advertising campaigns over a larger store base.
• Occupancy costs increased to $27.2 million, or 4.0% of net sales for 2011, from $22.2 million, or 3.6% of net sales
for 2010. The increase was primarily due to our store base expansion, and additional warehousing and distribution,
including in Canada.
• Depreciation and amortization increased to $8.3 million, or 1.2% of net sales for 2011, from $5.6 million, or 0.9%
of net sales for 2010. The increase was primarily related to our integrated information technology solution, which
we generally began depreciating in August 2010.
• Stock-based compensation expense related to the grant of stock options and restricted shares to employees and
directors was $4.0 million in 2011 and $3.1 million in 2010. As a percentage of net sales, stock-based
compensation expense increased to 0.6% in 2011, from 0.5% in 2010, primarily due to equity granted to certain
newly-hired executives.
• Other SG&A expenses increased $2.7 million in 2011 but remained a constant 3.8% of net sales. The increase was
primarily due to certain professional services related to the maintenance of our integrated information technology
solution, store-base growth and certain bankcard discount rate fees that increased due to greater consumer
preference for certain extended-term promotional programs.
• Our sourcing initiatives resulted in a net reduction in SG&A expenses of approximately 20 to 25 basis points in
2011.
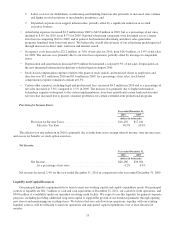
Provision for Income Taxes.
Year ended December 31,
2011 2010
(dollars in thousands)
Provision for Income Taxes ................................. $16,769 $16,476
Effective Tax Rate .................................... 39.0% 38.5%
The effective income tax rate increase in comparing 2011 to 2010 is primarily due to foreign taxes and certain
non-deductible expenses.
Net Income.
Year ended December 31,
2011 2010
(dollars in thousands)
Net Income .............................................. $26,256 $26,266
As a percentage of net sales ............................. 3.9% 4.2%
30