Lumber Liquidators 2011 Annual Report Download - page 34
Download and view the complete annual report
Please find page 34 of the 2011 Lumber Liquidators annual report below. You can navigate through the pages in the report by either clicking on the pages listed below, or by using the keyword search tool below to find specific information within the annual report.-
 1
1 -
2
-
3
-
4
-
5
-
6
-
7
-
8
-
9
-
10
-
11
-
12
-
13
-
14
-
15
-
16
-
17
-
18
-
19
-
20
-
21
-
22
-
23
-
 24
24 -
 25
25 -
 26
26 -
 27
27 -
 28
28 -
 29
29 -
 30
30 -
 31
31 -
 32
32 -
 33
33 -
 34
34 -
 35
35 -
 36
36 -
 37
37 -
 38
38 -
 39
39 -
 40
40 -
 41
41 -
 42
42 -
 43
43 -
 44
44 -
45
-
46
-
47
-
48
-
49
-
50
-
51
-
52
-
53
-
54
-
55
-
56
-
57
-
58
-
59
-
60
-
61
-
62
-
63
-
64
-
65
-
66
-
67
-
68
-
69
-
70
-
71
-
72
-
73
 |
 |

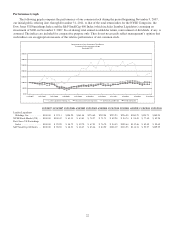
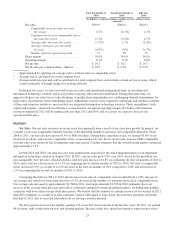
Available inventory per store at December 31, 2011 is lower than previous years primarily due to strengthened
merchandising, product allocation and distribution initiatives, supported by better information from our integrated
information technology solution, and our efforts to drive consumer traffic, particularly late in the fourth quarter. Available
inventory per store was elevated at December 31, 2010 primarily due to reduced productivity as a result of the
implementation of our integrated information technology solution.
SG&A Expenses. Labor costs and advertising expenses have historically been our most significant SG&A expenses.
Our total labor costs have increased as a percentage of net sales over the last three years due primarily to our store base
growth and investments in support infrastructure. Our annual advertising costs have increased as we continue to promote our
brand and implement direct sales generation programs in support of our growth, offset by national advertising leverage
across a larger store base and greater resources committed to our most effective media channels. Our SG&A expenses as a
percentage of net sales have been 29.1%, 28.0% and 27.7% in 2011, 2010 and 2009, respectively.
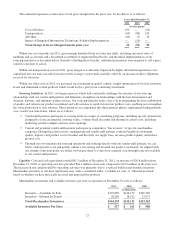
Other External Factors Impacting Our Business
Antidumping and Countervailing Duties Investigation. In October 2010, a conglomeration of domestic manufacturers
of multilayered wood flooring filed a petitions seeking the imposition of antidumping and countervailing duties with the
United States Department of Commerce (“DOC”) and the United States International Trade Commission (“ITC”) against
imports of multilayered wood flooring from China. In December 2010, the ITC made a preliminary determination that there
is a reasonable indication that imports of multilayered wood flooring from China have caused injury to the domestic
suppliers and, as a result, the DOC continued its investigation.
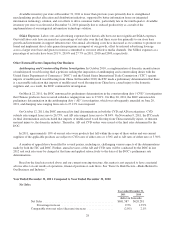
On March 22, 2011, the DOC announced its preliminary determination in the countervailing duty (“CVD”) investigation
that Chinese producers have received subsidies ranging from zero to 27.01%. On May 20, 2011, the DOC announced its
preliminary determination in the antidumping duty (“AD”) investigation, which was subsequently amended on June 20,
2011, and dumping rates ranging from zero to 27.12% were imposed.
On October 12, 2011, the DOC announced its final determinations in both the CVD and AD investigations. CVD
subsidy rates ranged from zero to 26.73%, and AD rates ranged from zero to 58.84%. On November 9, 2011, the ITC made
its final determination and concluded that imports of multilayered wood flooring from China materially injure, or threaten
material injury to, the domestic industry. Thereafter, AD and CVD orders were issued at the final rates determined by the
DOC.
In 2011, approximately 10% of our net sales were products that fall within the scope of these orders and our current
suppliers of the applicable products are subject to CVD rates of either zero or 1.50% and to AD rates of either zero or 3.30%.
A number of appeals have been filed by several parties, including us, challenging various aspects of the determinations
made by both the ITC and DOC. Further, annual reviews of the AD and CVD rates will be conducted by the DOC in late
2012 and such rates may be changed at that time and applied retroactively to the dates of the DOC’s preliminary rate
determinations.
Based on the final rates noted above and our current sourcing structure, this matter is not expected to have a material
adverse effect on our results of operations, financial position or cash flows. See “Item 1A. Risk Factors—Risks Related to
Our Business and Industry.”
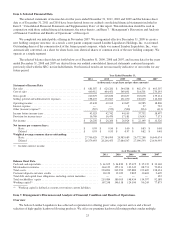
Year Ended December 31, 2011 Compared to Year Ended December 31, 2010
Net Sales.
Year ended December 31,
2011 2010
(dollars in thousands)
Net Sales ................................................ $681,587 $620,281
Percentage increase ................................... 9.9% 13.9%
Comparable store net sales (decrease) increase .................. (2.0%) 2.1%
28