Lumber Liquidators 2011 Annual Report Download - page 35
Download and view the complete annual report
Please find page 35 of the 2011 Lumber Liquidators annual report below. You can navigate through the pages in the report by either clicking on the pages listed below, or by using the keyword search tool below to find specific information within the annual report.-
 1
1 -
2
-
3
-
4
-
5
-
6
-
7
-
8
-
9
-
10
-
11
-
12
-
13
-
14
-
15
-
16
-
17
-
18
-
19
-
20
-
21
-
22
-
23
-
24
-
 25
25 -
 26
26 -
 27
27 -
 28
28 -
 29
29 -
 30
30 -
 31
31 -
 32
32 -
 33
33 -
 34
34 -
 35
35 -
 36
36 -
 37
37 -
 38
38 -
 39
39 -
 40
40 -
 41
41 -
 42
42 -
 43
43 -
 44
44 -
 45
45 -
46
-
47
-
48
-
49
-
50
-
51
-
52
-
53
-
54
-
55
-
56
-
57
-
58
-
59
-
60
-
61
-
62
-
63
-
64
-
65
-
66
-
67
-
68
-
69
-
70
-
71
-
72
-
73
 |
 |

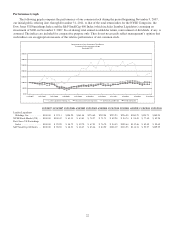
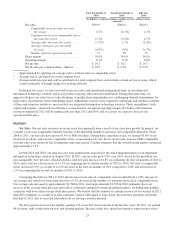
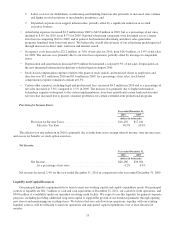
Net sales for 2011 increased $61.3 million, or 9.9%, over 2010 due to an increase of $73.8 million in non-comparable
store net sales which was offset by a $12.5 million decrease in comparable store net sales. In addition to the items discussed
in “Highlights”, our net sales have been impacted by the following factors:
• Net sales benefited from more consistent in-stock positions of certain key product lines, such as laminates,
moldings and accessories. These product lines are included within our “never out of stock” program through which
we have strengthened our in-stock commitment to our top selling products by region across all product lines. These
benefits were partially offset by decreased net sales in certain hardwood product lines.
• Net sales in the third and fourth quarters of 2010 were adversely impacted by our reduced productivity subsequent
to the August 2010 implementation of our integrated information technology solution. Specifically, inconsistent
servicing of new demand prior to a customer placing an order interrupted the normal sales cycle, resulting in either
delayed or lost sales.
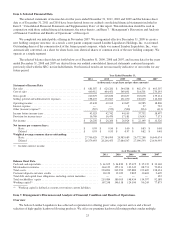
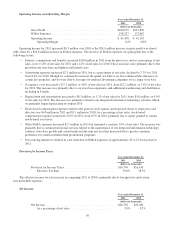
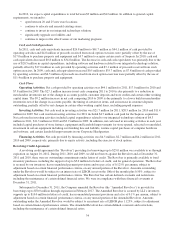
Gross Profit and Gross Margin.
Year ended December 31,
2011 2010
(dollars in thousands)
Net Sales ................................................ $681,587 $620,281
Cost of Sales ............................................. 440,912 404,451
Gross Profit .............................................. $240,675 $215,830
Gross Margin ........................................ 35.3% 34.8%
Gross profit in 2011 increased $24.9 million, or 11.5%, to $240.7 million in 2011 from $215.8 million in 2010. Gross
margin increased 50 basis points in 2011 as compared to 2010. As discussed in “Highlights”, this change was primarily due
to the following:
• Sales mix shifts from increased sales of moldings and accessories and broadened assortment of engineered
hardwoods expanded gross margin. Our sales mix of moldings and accessories increased to 14.6% of total net sales
in 2011, from 13.7% in 2010.
• As part of our sourcing initiatives in the current year, our vendors participated in a range of continuing programs
and we completed several line reviews. In September 2011, we entered into an agreement to acquire certain assets
of Sequoia relating to Sequoia’s quality control and assurance, product development, claims management and
logistics operations in China.
• Net transportation costs negatively impacted gross margin due primarily to higher inbound transportation costs
capitalized into our unit cost and an increase in the average cost per mile. Our international container rates are
impacted by negotiated container rates, our mix of shipments to the East Coast and West Coast of the U.S. and our
mix of 20’ and 40’ containers. In 2011, our negotiated international container rates were generally comparable to
those in 2010, however, certain other inbound transportation costs, primarily duties, continue to rise primarily due
to changes in our sales mix toward Asian products.
Partially offsetting these higher costs was an increase in direct shipments received by our stores, either direct from
the mill or through our China consolidation center. In 2011, 22.9% of our unit purchases were received directly at
the store, up from 19.1% in 2010. Transportation costs of moving our products from our warehouses to the final
sales floor increased due to a per mile increase, primarily resulting from increases in fuel surcharges, partially
offset by fewer road miles traveled.
• Increased investment in our quality control procedures, particularly those related to South American exotic
hardwoods, increased certain product costs. We significantly strengthened our inspection efforts over milling in the
country of origin. We believe that, over time, these efforts will benefit gross profit through a stronger customer
value proposition.
• In 2011, primarily in the fourth quarter, we took steps to optimize inventory levels through regional assortment
planning, eliminating certain product lines which would not be a part of continuing inventory and the
implementation of stricter procedures to eliminate residual liquidation inventory.
29