Lumber Liquidators 2011 Annual Report Download - page 37
Download and view the complete annual report
Please find page 37 of the 2011 Lumber Liquidators annual report below. You can navigate through the pages in the report by either clicking on the pages listed below, or by using the keyword search tool below to find specific information within the annual report.-
 1
1 -
2
-
3
-
4
-
5
-
6
-
7
-
8
-
9
-
10
-
11
-
12
-
13
-
14
-
15
-
16
-
17
-
18
-
19
-
20
-
21
-
22
-
23
-
24
-
25
-
26
-
 27
27 -
 28
28 -
 29
29 -
 30
30 -
 31
31 -
 32
32 -
 33
33 -
 34
34 -
 35
35 -
 36
36 -
 37
37 -
 38
38 -
 39
39 -
 40
40 -
 41
41 -
 42
42 -
 43
43 -
 44
44 -
 45
45 -
 46
46 -
 47
47 -
48
-
49
-
50
-
51
-
52
-
53
-
54
-
55
-
56
-
57
-
58
-
59
-
60
-
61
-
62
-
63
-
64
-
65
-
66
-
67
-
68
-
69
-
70
-
71
-
72
-
73
 |
 |

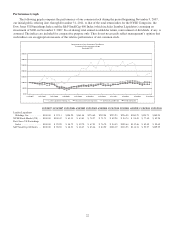
Net income for the year ended December 31, 2011 remained flat with the year ended December 31, 2010.
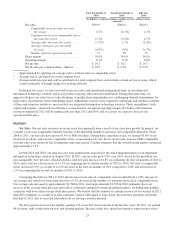
Year Ended December 31, 2010 Compared to Year Ended December 31, 2009
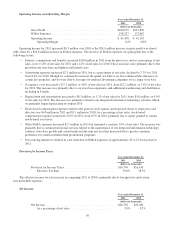
Net Sales.
Year ended December 31,
2010 2009
(dollars in thousands)
Net Sales ................................................ $620,281 $544,568
Percentage increase ................................... 13.9% 12.9%
Comparable store net sales increase ........................... 2.1% 0.0%
Net sales for 2010 increased $75.7 million, or 13.9%, over 2009 due to an increase of $64.2 million in non-comparable
store net sales and an $11.5 million increase in comparable store net sales. Net sales were impacted by the following:
• The loss of productivity following our system implementation in August 2010 weakened net sales at comparable
stores in the second half of 2010. As a result, we reversed a trend in quarterly net sales, which had gradually
strengthened each quarter since the beginning of 2009. In the first six months of 2010, our net sales in comparable
stores increased 6.7% compared to the six months ended June 30, 2009. In contrast, when comparing the third and
fourth quarters of 2010 to the same six months in 2009, our net sales at comparable stores decreased 2.3%. On a
quarterly basis, net sales at comparable stores decreased 5.7% in comparing the third quarters of 2010 and 2009,
and increased 1.2% when comparing the fourth quarters of 2010 and 2009.
• Net sales for 2010 benefited from an increase in the number of customers invoiced in our comparable stores. We
believe the increases in the number of customers invoiced resulted from strengthening consumer demand for our
expanded assortment of products, and the incremental traffic generated by certain promotional pricing. The loss of
productivity following the system implementation significantly impacted the number of 2010 customers invoiced
compared to 2009. The number of customers invoiced at our comparable stores in the first half of 2010 increased
13.1% compared to the first half of 2009. However, in comparing the second half of the year, the number of
customers invoiced decreased 3.6% from 2009 to 2010. Our monthly comparisons of customers invoiced in
comparable stores were negative from August through November and returned positive in December, where 2010
increased 1.8% over 2009.
• Our average sale in 2010 declined in comparison to 2009. We believe the decrease in our average sale for the full
year was a result of consumer demand shifting our mix of products sold, or sales mix, to certain key product lines
which generally had a lower than average retail price per unit. We believe we grew our market share in these
product lines. However, the average sale increased each quarter in 2010, from a low of $1,440 in the first quarter to
$1,560 in the fourth quarter. In 2009, the average sale had fallen each quarter, from $1,600 in the first quarter to
$1,510 in the fourth quarter. The fourth quarter comparison of $1,560 in 2010 to $1,510 in 2009 represented the
first year-over-year increase since the second quarter of 2008. The gradual strengthening of our average sale in
2010 was also a result of changes in our sales mix, including demand for our hardwood products.
• Net sales benefited from more consistent in-stock positions of certain key product lines, including product lines
customers expected to be in-stock at a store location, such as laminates, moldings and accessories. Our sales mix of
moldings and accessories increased to 13.7% of total net sales in 2010, from 12.7% in 2009. These benefits were
partially offset by full year decreases in certain hardwood product lines.
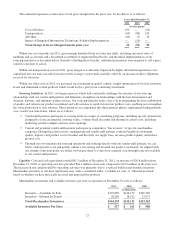
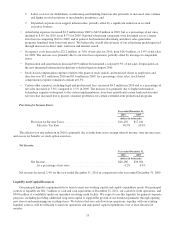
Gross Profit and Gross Margin.
Year ended December 31,
2010 2009
(dollars in thousands)
Net Sales ................................................ $620,281 $544,568
Cost of Sales ............................................. 404,451 349,891
Gross Profit .............................................. $215,830 $194,677
Gross Margin ........................................ 34.8% 35.7%
31