Lumber Liquidators 2011 Annual Report Download - page 32
Download and view the complete annual report
Please find page 32 of the 2011 Lumber Liquidators annual report below. You can navigate through the pages in the report by either clicking on the pages listed below, or by using the keyword search tool below to find specific information within the annual report.-
 1
1 -
2
-
3
-
4
-
5
-
6
-
7
-
8
-
9
-
10
-
11
-
12
-
13
-
14
-
15
-
16
-
17
-
18
-
19
-
20
-
21
-
 22
22 -
 23
23 -
 24
24 -
 25
25 -
 26
26 -
 27
27 -
 28
28 -
 29
29 -
 30
30 -
 31
31 -
 32
32 -
 33
33 -
 34
34 -
 35
35 -
 36
36 -
 37
37 -
 38
38 -
 39
39 -
 40
40 -
 41
41 -
 42
42 -
43
-
44
-
45
-
46
-
47
-
48
-
49
-
50
-
51
-
52
-
53
-
54
-
55
-
56
-
57
-
58
-
59
-
60
-
61
-
62
-
63
-
64
-
65
-
66
-
67
-
68
-
69
-
70
-
71
-
72
-
73
 |
 |

and the attractive returns on investment our stores generate, we intend to continue to expand our store base. We believe our
existing primary and secondary metropolitan markets will benefit from additional stores, and certain smaller markets will
benefit from our initial entry into the market. In the coming year, we plan to significantly enhance our focus on optimizing
market potential, utilizing both new store openings and a combination of existing store relocation, major remodeling and
assortment expansion. As a result, we expect to slow the growth of our overall new store count in 2012 in order to enhance
the return on resources invested in a market.
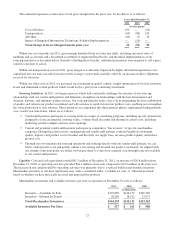
Our recent store opening activity is as follows:
2011 2010 2009
Number of stores at January 1 .......................................... 223 186 150
New U.S. stores ................................................. 33 37 36
New Canadian stores ............................................. 7 — —
Number of stores at December 31 263 223 186
Net sales at our non-comparable stores are generally lowest in the first few months after a location is opened, and
increase with maturity. Overall, we expect a store’s net sales to increase faster during its first three years of operation than in
its later years. Store locations opened in existing markets tend to have higher net sales in the first year of operation than store
locations opened in new markets, as a portion of those net sales come from more mature stores in the market.
We evaluate our net sales performance by market. We segregate our markets into those where all stores are comparable
and those which have at least one comparable store and one non-comparable store, often referred to as “cannibalized”
markets. In cannibalized markets, we evaluate the total increase in the net sales of the market.
Year ended December 31,
2011 2010 2009
(dollars in millions)
Total comparable store net sales (decrease) increase .................. (2.0%) 2.1% 0.0%
Markets with all stores comparable (no cannibalization):
Comparable store net sales increase ........................... 2.2% 5.5% 4.1%
Cannibalized markets:
Comparable store net sales decrease ........................... $(22.8) $(10.5) $(15.3)
Percentage decrease .................................... (14.2%) (7.4%) (13.3%)
Non-comparable store net sales increase ........................ $52.7 $ 32.8 $ 26.5
Net increase in net sales of cannibalized markets ................... $29.9 $ 22.3 $ 11.2
Total increase in net sales of cannibalized markets ............... 18.6% 15.8% 9.7%
As shown above, though our comparable store net sales were cannibalized $22.8 million, or 14.2%, by our opening of
non-comparable stores in existing markets, we increased the total net sales of those markets by $29.9 million, or 18.6%.
Cost of Sales. In 2011, 2010 and 2009, our gross margin has been 35.3%, 34.8% and 35.7%, respectively. The key
drivers of our gross margin are as follows:
Driver Description
Cost of Product ..... Cost of acquiring the products we sell from our suppliers, including the impact
of our sourcing initiatives; Changes in the mix of products sold; Changes in the
average retail price per unit sold.
Transportation ...... International and domestic transportation costs, including the impact of
international container rates; Customs and duty charges; Fuel and fuel
surcharges; Impact of vendor-mill shipments received directly by our store
locations; Transportation charges from our distribution centers to our store
locations; Transportation charges between store locations and the cost of
delivery to our customers (revenue in net sales).
All Other .......... Investments in our quality control procedures; Warranty costs; Changes in
finishing costs to produce a unit of our proprietary brands; Inventory shrink;
Net costs of producing samples.
26