Lumber Liquidators 2011 Annual Report Download - page 48
Download and view the complete annual report
Please find page 48 of the 2011 Lumber Liquidators annual report below. You can navigate through the pages in the report by either clicking on the pages listed below, or by using the keyword search tool below to find specific information within the annual report.-
 1
1 -
2
-
3
-
4
-
5
-
6
-
7
-
8
-
9
-
10
-
11
-
12
-
13
-
14
-
15
-
16
-
17
-
18
-
19
-
20
-
21
-
22
-
23
-
24
-
25
-
26
-
27
-
28
-
29
-
30
-
31
-
32
-
33
-
34
-
35
-
36
-
37
-
 38
38 -
 39
39 -
 40
40 -
 41
41 -
 42
42 -
 43
43 -
 44
44 -
 45
45 -
 46
46 -
 47
47 -
 48
48 -
 49
49 -
 50
50 -
 51
51 -
 52
52 -
 53
53 -
 54
54 -
 55
55 -
 56
56 -
 57
57 -
 58
58 -
59
-
60
-
61
-
62
-
63
-
64
-
65
-
66
-
67
-
68
-
69
-
70
-
71
-
72
-
73
 |
 |

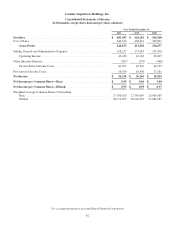
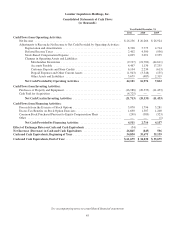
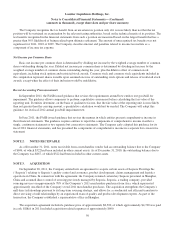
Lumber Liquidators Holdings, Inc.
Consolidated Statements of Income
(in thousands, except share data and per share amounts)
Year Ended December 31,
2011 2010 2009
Net Sales ........................................................ $ 681,587 $ 620,281 $ 544,568
Cost of Sales ...................................................... 440,912 404,451 349,891
Gross Profit .................................................. 240,675 215,830 194,677
Selling, General and Administrative Expenses ........................... 198,237 173,667 151,070
Operating Income .............................................. 42,438 42,163 43,607
Other (Income) Expense ............................................. (587) (579) (498)
Income Before Income Taxes ..................................... 43,025 42,742 44,105
Provision for Income Taxes .......................................... 16,769 16,476 17,181
Net Income ...................................................... $ 26,256 $ 26,266 $ 26,924
Net Income per Common Share—Basic ............................... $ 0.95 $ 0.96 $ 1.00
Net Income per Common Share—Diluted ............................. $ 0.93 $ 0.93 $ 0.97
Weighted Average Common Shares Outstanding:
Basic ........................................................ 27,706,629 27,384,095 26,983,689
Diluted ...................................................... 28,379,693 28,246,453 27,684,547
See accompanying notes to consolidated financial statements
42