Lumber Liquidators 2011 Annual Report Download - page 31
Download and view the complete annual report
Please find page 31 of the 2011 Lumber Liquidators annual report below. You can navigate through the pages in the report by either clicking on the pages listed below, or by using the keyword search tool below to find specific information within the annual report.-
 1
1 -
2
-
3
-
4
-
5
-
6
-
7
-
8
-
9
-
10
-
11
-
12
-
13
-
14
-
15
-
16
-
17
-
18
-
19
-
20
-
 21
21 -
 22
22 -
 23
23 -
 24
24 -
 25
25 -
 26
26 -
 27
27 -
 28
28 -
 29
29 -
 30
30 -
 31
31 -
 32
32 -
 33
33 -
 34
34 -
 35
35 -
 36
36 -
 37
37 -
 38
38 -
 39
39 -
 40
40 -
 41
41 -
42
-
43
-
44
-
45
-
46
-
47
-
48
-
49
-
50
-
51
-
52
-
53
-
54
-
55
-
56
-
57
-
58
-
59
-
60
-
61
-
62
-
63
-
64
-
65
-
66
-
67
-
68
-
69
-
70
-
71
-
72
-
73
 |
 |

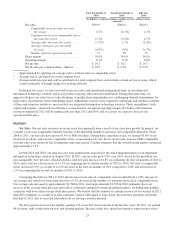
First Six Months of
2010
Second Six Months of
2010
Full Year
2010
(in millions, except percentages, number of stores and per share
amounts)
Net sales ............................... $319.9 $300.4 $620.3
Comparable store net sales increase
(decrease) ....................... 6.7% (2.3%) 2.1%
Customers invoiced at comparable stores1
increase (decrease) ................ 13.1% (3.6%) 4.5%
Average sale2increase (decrease) ....... (5.7%) 1.3% (2.4%)
Average retail price per unit sold3
decrease ......................... (6.9%) 0.0% (3.7%)
Number of stores opened in period ...... 17 20 37
Gross margin ........................... 35.0% 34.6% 34.8%
Operating margin ........................ 8.1% 5.4% 6.8%
Net income ............................. $ 16.1 $ 10.2 $ 26.3
Net income per common share—diluted ...... $ 0.57 $ 0.36 $ 0.93
1Approximated by applying our average sale to total net sales at comparable stores
2Average sale is calculated on a total company basis
3Average retail price per unit sold is calculated on a total company basis and excludes certain service revenue, which
consists primarily of freight charges for in-home delivery
In the past two years, we have invested in our executive and operational management team, in our integrated
information technology solution, and in our product sourcing, allocation and distribution. During that same time, we
aggressively grew our store base to take advantage of market share opportunities in a challenging demand environment for
large-ticket, discretionary home remodeling spend. Additional resources were required to implement and stabilize a number
of these infrastructure initiatives, most notably our integrated information technology solution. These expenditures, both
capital and expense, contracted our efficiency as measured by our annual operating margin. We believe infrastructure
resources required in 2012 will be significantly less than 2011 and 2010, and as a result, we expect to increase our
operational efficiency.
Highlights
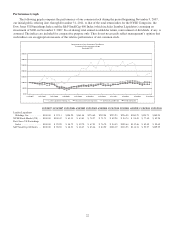
Net Sales. Our net sales increases in recent years have primarily been a result of our store base growth. In general, we
consider a store non-comparable until the first day of the thirteenth month of operation, and comparable thereafter. From
2008 to 2011, our net sales have grown 41.4% to $681.6 million. During those same three years, we opened 43.0% of our
total store locations, and our non-comparable stores, as measured each year, drove our net sales increase while comparable
store net sales were relatively flat. During that same time period, Catalina estimates that the wood flooring market contracted
approximately 13.5%.
In both 2011 and 2010, our total net sales were significantly impacted by the initial implementation of our integrated
information technology solution in August 2010. In 2011, our net sales grew 9.9% over 2010, driven by the growth in our
non-comparable store net sales, which included a total net sales increase of 4.8% in comparing the first six months of 2011 to
2010, and a total net sales increase of 15.3% in comparing the second six months of 2011 to 2010. Net sales at comparable
stores decreased 2.0% as a result of a 6.2% decrease in the first six months of 2011 compared to 2010, and an increase of
2.5% in comparing the second six months of 2011 to 2010.
Comparing the full year 2011 to 2010, the decrease in net sales at comparable stores resulted from a 2.8% increase in
our average sale which was more than offset by a 4.7% decrease in the number of customers invoiced at comparable stores.
Our average sale increased to approximately $1,560 in 2011, from approximately $1,520 in 2010, primarily due to an
increase in the average retail price per unit sold as customers continued to prefer premium products, including merchandise
categories with lower than average retail price points. We believe that the number of customers invoiced was weaker in 2011
than 2010, primarily as a result of greater consumer caution with regard to large-ticket, discretionary purchases and in the
first half of 2011, due to our reduced productivity in serving customer demand.
We have grown our store base rapidly, opening 172 of our 263 store locations in the last five years. In 2011, we opened
40 locations, split evenly between new and existing markets. Because of the low capital investment to open our new stores
25