Lumber Liquidators 2011 Annual Report Download - page 38
Download and view the complete annual report
Please find page 38 of the 2011 Lumber Liquidators annual report below. You can navigate through the pages in the report by either clicking on the pages listed below, or by using the keyword search tool below to find specific information within the annual report.-
 1
1 -
2
-
3
-
4
-
5
-
6
-
7
-
8
-
9
-
10
-
11
-
12
-
13
-
14
-
15
-
16
-
17
-
18
-
19
-
20
-
21
-
22
-
23
-
24
-
25
-
26
-
27
-
 28
28 -
 29
29 -
 30
30 -
 31
31 -
 32
32 -
 33
33 -
 34
34 -
 35
35 -
 36
36 -
 37
37 -
 38
38 -
 39
39 -
 40
40 -
 41
41 -
 42
42 -
 43
43 -
 44
44 -
 45
45 -
 46
46 -
 47
47 -
 48
48 -
49
-
50
-
51
-
52
-
53
-
54
-
55
-
56
-
57
-
58
-
59
-
60
-
61
-
62
-
63
-
64
-
65
-
66
-
67
-
68
-
69
-
70
-
71
-
72
-
73
 |
 |

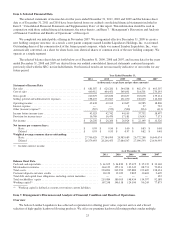
Gross profit in 2010 increased $21.2 million, or 10.9%, to $215.8 million in 2010 from $194.7 million in 2009. Gross
margin decreased 95 basis points in 2010 as compared to 2009. This decrease was primarily due to increased product costs
resulting primarily from the following:
• Our loss of productivity subsequent to the system implementation resulted in less efficient unit flow, including
expedited transportation, and reduced gross margin by approximately 10 to 12 basis points.
• Transportation costs of moving our products from our warehouses in Virginia to the store locations, between store
locations, and to the customer from our store locations are charged to cost of sales as incurred. These costs
increased due to both a per mile increase, primarily due to increases in fuel surcharges, and an increase in the
number of miles driven, primarily due to a greater number of units shipped. The increase in units shipped primarily
resulted from a combination of our increase in sales volume, including the sales mix shift to a lower average retail
price, and generally higher in-store average inventory levels.
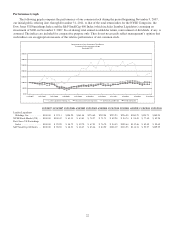
• Inbound transportation costs capitalized into the unit cost of products sold were generally higher in 2010 than in
2009. International container rates reached a low point against our historic norm in the second half of 2009, rose to
a peak well above our historic norm in the summer of 2010 and fell back to approximate our historic norm
thereafter.
Partially offsetting these transportation cost increases were increased direct shipments received by our stores, either
through our China consolidation center or direct from the mill to the store. In 2010, 19.1% of our unit purchases
were received directly at the store, up from 16.4% in 2009. In the second half of 2010, these direct shipments
represented 23.8% of our unit purchases, up from 14.7% in the second half of 2009.
• Our efforts to expand and regionalize our assortment of Bellawood products resulted in 2010 per unit finishing
costs generally higher than those in 2009, primarily due to greater demand for products which were less efficient to
finish.
In aggregate, sales mix shifts were neutral to gross margin, including:
• Gross margin benefited from our continued efforts to broaden the assortment and strengthen the in-stock positions
of moldings and accessories, as well as laminates and certain engineered hardwoods, particularly the premium
products. These product lines generally carried a higher than average gross margin.
• Gross margin was adversely impacted by a strengthening in consumer demand for certain hardwoods, particularly
those at the entry level, which generally carry higher than average retail price points, but lower than average gross
margins.
• Liquidation deals, used as promotional opportunities to generate incremental traffic, generally yielded lower gross
margins in 2010 than in 2009, and in each year, those gross margins were lower than average.
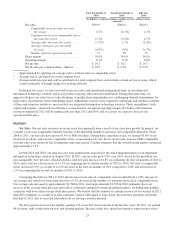
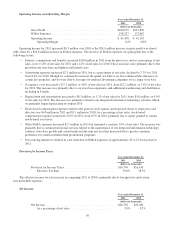
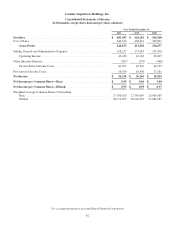
Operating Income and Operating Margin.
Year ended December 31,
2010 2009
(dollars in thousands)
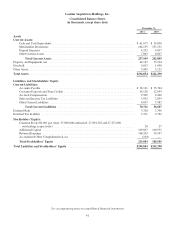
Gross Profit .............................................. $215,830 $194,677
SG&A Expenses .......................................... 173,667 151,070
Operating Income ......................................... $ 42,163 $ 43,607
Operating Margin ..................................... 6.8% 8.0%
Operating income for 2010 decreased $1.4 million, or 3.3%, over 2009 as the $21.2 million increase in gross profit was
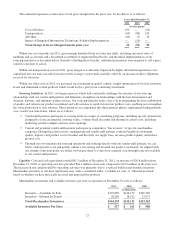
offset by a $22.6 million increase in SG&A expenses. The increase in SG&A expenses was principally due to the following
factors:
• Approximately $0.9 million in incremental expenses related to the system implementation.
• Salaries, commissions and benefits increased $10.7 million in 2010 from the prior year, and as a percentage of net
sales, were 11.2% of net sales for 2010 and 10.8% of net sales for 2009. These increases were primarily due to:
OGrowth in our store base, a greater commitment to in-store management and staffing at certain smaller stores,
as well as an expanded store training program;
32