Logitech 2014 Annual Report Download - page 260
Download and view the complete annual report
Please find page 260 of the 2014 Logitech annual report below. You can navigate through the pages in the report by either clicking on the pages listed below, or by using the keyword search tool below to find specific information within the annual report.-
 1
1 -
2
-
3
-
4
-
5
-
6
-
7
-
8
-
9
-
10
-
11
-
12
-
13
-
14
-
15
-
16
-
17
-
18
-
19
-
20
-
21
-
22
-
23
-
24
-
25
-
26
-
27
-
28
-
29
-
30
-
31
-
32
-
33
-
34
-
35
-
36
-
37
-
38
-
39
-
40
-
41
-
42
-
43
-
44
-
45
-
46
-
47
-
48
-
49
-
50
-
51
-
52
-
53
-
54
-
55
-
56
-
57
-
58
-
59
-
60
-
61
-
62
-
63
-
64
-
65
-
66
-
67
-
68
-
69
-
70
-
71
-
72
-
73
-
74
-
75
-
76
-
77
-
78
-
79
-
80
-
81
-
82
-
83
-
84
-
85
-
86
-
87
-
88
-
89
-
90
-
91
-
92
-
93
-
94
-
95
-
96
-
97
-
98
-
99
-
100
-
101
-
102
-
103
-
104
-
105
-
106
-
107
-
108
-
109
-
110
-
111
-
112
-
113
-
114
-
115
-
116
-
117
-
118
-
119
-
120
-
121
-
122
-
123
-
124
-
125
-
126
-
127
-
128
-
129
-
130
-
131
-
132
-
133
-
134
-
135
-
136
-
137
-
138
-
139
-
140
-
141
-
142
-
143
-
144
-
145
-
146
-
147
-
148
-
149
-
150
-
151
-
152
-
153
-
154
-
155
-
156
-
157
-
158
-
159
-
160
-
161
-
162
-
163
-
164
-
165
-
166
-
167
-
168
-
169
-
170
-
171
-
172
-
173
-
174
-
175
-
176
-
177
-
178
-
179
-
180
-
181
-
182
-
183
-
184
-
185
-
186
-
187
-
188
-
189
-
190
-
191
-
192
-
193
-
194
-
195
-
196
-
197
-
198
-
199
-
200
-
201
-
202
-
203
-
204
-
205
-
206
-
207
-
208
-
209
-
210
-
211
-
212
-
213
-
214
-
215
-
216
-
217
-
218
-
219
-
220
-
221
-
222
-
223
-
224
-
225
-
226
-
227
-
228
-
229
-
230
-
231
-
232
-
233
-
234
-
235
-
236
-
237
-
238
-
239
-
240
-
241
-
242
-
243
-
244
-
245
-
246
-
247
-
248
-
249
-
 250
250 -
 251
251 -
 252
252 -
 253
253 -
 254
254 -
 255
255 -
 256
256 -
 257
257 -
 258
258 -
 259
259 -
 260
260 -
 261
261 -
 262
262 -
 263
263 -
 264
264 -
 265
265 -
 266
266 -
 267
267 -
 268
268 -
 269
269 -
 270
270 -
271
-
272
-
273
-
274
-
275
-
276
-
277
-
278
-
279
-
280
-
281
-
282
-
283
-
284
-
285
-
286
-
287
-
288
-
289
-
290
-
291
-
292
-
293
-
294
-
295
-
296
-
297
-
298
-
299
-
300
-
301
-
302
-
303
-
304
-
305
-
306
-
307
-
308
 |
 |

LOGITECH INTERNATIONAL S.A.
NOTES TO CONSOLIDATED FINANCIAL STATEMENTS (Continued)
Note 3 — Summary of Significant Accounting Policies (Continued)
Restructuring Charges
The Company’s restructuring charges consist of employee severance, one-time termination benefits and
ongoing benefits related to the reduction of its workforce, lease exit costs, and other costs. Liabilities for costs
associated with a restructuring activity are measured at fair value and are recognized when the liability is incurred,
as opposed to when management commits to a restructuring plan. One-time termination benefits are expensed
at the date the entity notifies the employee, unless the employee must provide future service, in which case the
benefits are expensed ratably over the future service period. Ongoing benefits are expensed when restructuring
activities are probable and the benefit amounts are estimable. Costs to terminate a lease before the end of its term
are recognized when the property is vacated. Other costs primarily consist of legal, consulting, and other costs
related to employee terminations and are expensed when incurred. Termination benefits are calculated based on
regional benefit practices and local statutory requirements.
Recent Accounting Pronouncements
In July 2013, the FASB issued Accounting Standards Update (“ASU”) No. 2013-11, Presentation of
an Unrecognized Tax Benefit When a Net Operating Loss Carryforward, a Similar Tax Loss, or a Tax Credit
Carryforward Exists. This ASU provides explicit guidance on the financial statement presentation of an
unrecognized tax benefit when a net operating loss carryforward, a similar tax loss, or a tax credit carryforward
exists. ASU No. 2013-11 is effective for interim and annual periods beginning after December 15, 2013 and was
effective for the Company in the first quarter of fiscal 2015.
In May 2014, the FASB issued Accounting Standards Update No. 2014-09, “Revenue from Contracts with
Customers (Topic 606),” (“ASU 2014-09”). ASU 2014-09 outlines a new, single comprehensive model for entities to
use in accounting for revenue arising from contracts with customers and supersedes most current revenue recognition
guidance, including industry- specific guidance. This new revenue recognition model provides a five-step analysis
in determining when and how revenue is recognized. The new model will require revenue recognition to depict the
transfer of promised goods or services to customers in an amount that reflects the consideration a company expects
to receive in exchange for those goods or services. The new standard will be effective for the Company beginning
April 1, 2017. Early application is prohibited. The Company is currently evaluating the impact that adopting this
new accounting guidance will have on its consolidated financial statements.
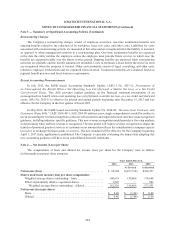
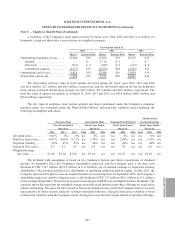
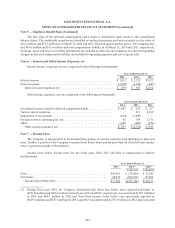
Note 4 — Net Income (Loss) per Share
The computations of basic and diluted net income (loss) per share for the Company were as follows
(in thousands except per share amounts):
Years Ended March 31,
2014 2013 2012
As Revised As Restated
Net income (loss) . . . . . . . . . . . . . . . . . . . . . . . . . . . . . . . . . . . . . . . . . . $ 74,304 $(227,518) $104,237
Shares used in net income (loss) per share computation:
Weighted average shares outstanding—basic . . . . . . . . . . . . . . . . . . 160,619 158,468 174,648
Effect of potentially dilutive equivalent shares . . . . . . . . . . . . . . . . . 1,907 — 943
Weighted average shares outstanding—diluted. . . . . . . . . . . . . . 162,526 158,468 175,591
Net income (loss) per share:
Basic. . . . . . . . . . . . . . . . . . . . . . . . . . . . . . . . . . . . . . . . . . . . . . . . . . $ 0.46 $ (1.44) $ 0.60
Diluted . . . . . . . . . . . . . . . . . . . . . . . . . . . . . . . . . . . . . . . . . . . . . . . . $ 0.46 $ (1.44) $ 0.59
244