Logitech 2014 Annual Report Download - page 251
Download and view the complete annual report
Please find page 251 of the 2014 Logitech annual report below. You can navigate through the pages in the report by either clicking on the pages listed below, or by using the keyword search tool below to find specific information within the annual report.-
 1
1 -
2
-
3
-
4
-
5
-
6
-
7
-
8
-
9
-
10
-
11
-
12
-
13
-
14
-
15
-
16
-
17
-
18
-
19
-
20
-
21
-
22
-
23
-
24
-
25
-
26
-
27
-
28
-
29
-
30
-
31
-
32
-
33
-
34
-
35
-
36
-
37
-
38
-
39
-
40
-
41
-
42
-
43
-
44
-
45
-
46
-
47
-
48
-
49
-
50
-
51
-
52
-
53
-
54
-
55
-
56
-
57
-
58
-
59
-
60
-
61
-
62
-
63
-
64
-
65
-
66
-
67
-
68
-
69
-
70
-
71
-
72
-
73
-
74
-
75
-
76
-
77
-
78
-
79
-
80
-
81
-
82
-
83
-
84
-
85
-
86
-
87
-
88
-
89
-
90
-
91
-
92
-
93
-
94
-
95
-
96
-
97
-
98
-
99
-
100
-
101
-
102
-
103
-
104
-
105
-
106
-
107
-
108
-
109
-
110
-
111
-
112
-
113
-
114
-
115
-
116
-
117
-
118
-
119
-
120
-
121
-
122
-
123
-
124
-
125
-
126
-
127
-
128
-
129
-
130
-
131
-
132
-
133
-
134
-
135
-
136
-
137
-
138
-
139
-
140
-
141
-
142
-
143
-
144
-
145
-
146
-
147
-
148
-
149
-
150
-
151
-
152
-
153
-
154
-
155
-
156
-
157
-
158
-
159
-
160
-
161
-
162
-
163
-
164
-
165
-
166
-
167
-
168
-
169
-
170
-
171
-
172
-
173
-
174
-
175
-
176
-
177
-
178
-
179
-
180
-
181
-
182
-
183
-
184
-
185
-
186
-
187
-
188
-
189
-
190
-
191
-
192
-
193
-
194
-
195
-
196
-
197
-
198
-
199
-
200
-
201
-
202
-
203
-
204
-
205
-
206
-
207
-
208
-
209
-
210
-
211
-
212
-
213
-
214
-
215
-
216
-
217
-
218
-
219
-
220
-
221
-
222
-
223
-
224
-
225
-
226
-
227
-
228
-
229
-
230
-
231
-
232
-
233
-
234
-
235
-
236
-
237
-
238
-
239
-
240
-
 241
241 -
 242
242 -
 243
243 -
 244
244 -
 245
245 -
 246
246 -
 247
247 -
 248
248 -
 249
249 -
 250
250 -
 251
251 -
 252
252 -
 253
253 -
 254
254 -
 255
255 -
 256
256 -
 257
257 -
 258
258 -
 259
259 -
 260
260 -
 261
261 -
262
-
263
-
264
-
265
-
266
-
267
-
268
-
269
-
270
-
271
-
272
-
273
-
274
-
275
-
276
-
277
-
278
-
279
-
280
-
281
-
282
-
283
-
284
-
285
-
286
-
287
-
288
-
289
-
290
-
291
-
292
-
293
-
294
-
295
-
296
-
297
-
298
-
299
-
300
-
301
-
302
-
303
-
304
-
305
-
306
-
307
-
308
 |
 |

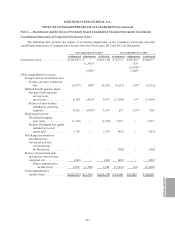
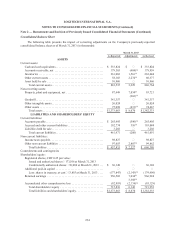
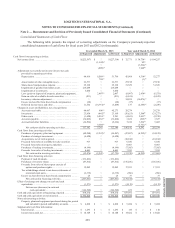
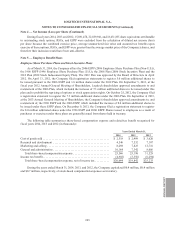
LOGITECH INTERNATIONAL S.A.
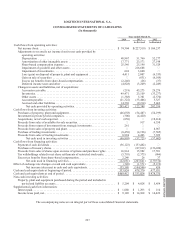
NOTES TO CONSOLIDATED FINANCIAL STATEMENTS (Continued)
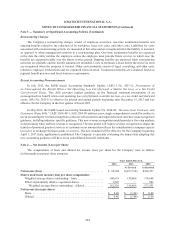
Consolidated Statements of Cash Flows
The following table presents the impact of correcting adjustments on the Company’s previously-reported
consolidated statements of cash flows for fiscal years 2013 and 2012 (in thousands):
Year ended March 31, 2013 Year ended March 31, 2012
As Reported Adjustments As Revised As Reported Adjustments As Restated
Cash flows from operating activities:
Net income (loss) . . . . . . . . . . . . . . . . . . . . . . . . . . . . . . . . . . . . . . $ (225,567) $ — $ (227,518) $ 72,771 $ 30,730(1) $ 104,237
(1,342)(2) 82(2)
— (1,294)(3)
(609)(4) 1,948(4)
Adjustments to reconcile net income (loss) to net cash
provided by operating activities:
Depreciation . . . . . . . . . . . . . . . . . . . . . . . . . . . . . . . . . . . . . . 44,419 6,589(2) 51,766 45,968 6,310(2) 52,277
758(4) (1)(4)
Amortization of other intangible assets . . . . . . . . . . . . . . . . . 23,571 — 23,571 27,198 — 27,198
Share-based compensation expense . . . . . . . . . . . . . . . . . . . . 25,198 — 25,198 31,529 — 31,529
Impairment of goodwill and other assets . . . . . . . . . . . . . . . . 216,688 — 216,688 — — —
Impairment of investments . . . . . . . . . . . . . . . . . . . . . . . . . . . 3,600 — 3,600 — — —
Loss (gain) on disposal of property, plant and equipment. . . — 2,007(4) 2,007 (8,967) 2,434(4) (6,533)
Gain on sales of available-for-sale securities. . . . . . . . . . . . . (831) — (831) (6,109) — (6,109)
Inventory valuation adjustment . . . . . . . . . . . . . . . . . . . . . . . — — — 34,074 (34,074)(1) —
Excess tax benefits from share-based compensation . . . . . . (26) — (26) (37) — (37)
Deferred income taxes and other . . . . . . . . . . . . . . . . . . . . . . 11,552 (14,761)(4) (3,209) 137 (2,386)(4) (2,249)
Changes in assets and liabilities, net of acquisitions:
Accounts receivable . . . . . . . . . . . . . . . . . . . . . . . . . . . . . . . . 44,667 606(4) 45,273 29,279 — 29,279
Inventories. . . . . . . . . . . . . . . . . . . . . . . . . . . . . . . . . . . . . . . . 23,954 (845)(4) 23,109 (36,621) 3,344(4) (33,277)
Other assets . . . . . . . . . . . . . . . . . . . . . . . . . . . . . . . . . . . . . . . (1,420) 6,801(4) 5,381 (4,621) 2,051(4) (2,570)
Accounts payable . . . . . . . . . . . . . . . . . . . . . . . . . . . . . . . . . . (34,069) 663(4) (33,406) 3,622 (295)(4) 3,327
Accrued and other liabilities. . . . . . . . . . . . . . . . . . . . . . . . . . (14,594) — (9,214) 7,919 1,294(3) 5,462
5,380(4) (3,751)(4)
Net cash provided by operating activities . . . . . . . . . . . . 117,142 5,247 122,389 196,142 6,392 202,534
Cash flows from investing activities:
Purchases of property, plant and equipment . . . . . . . . . . . . . (49,240) (5,247)(2) (54,487) (47,807) (6,392)(2) (54,199)
Purchase of strategic investment . . . . . . . . . . . . . . . . . . . . . . (4,420) — (4,420) — — —
Acquisitions, net of cash acquired . . . . . . . . . . . . . . . . . . . . . — — — (18,814) — (18,814)
Proceeds from sales of available-for-sale securities . . . . . . . 917 — 917 6,550 — 6,550
Proceeds from sales of property and plant. . . . . . . . . . . . . . . — — — 8,967 — 8,967
Purchases of trading investments. . . . . . . . . . . . . . . . . . . . . . (4,196) — (4,196) (7,505) — (7,505)
Proceeds from sales of trading investments. . . . . . . . . . . . . . 4,463 — 4,463 7,399 — 7,399
Net cash used in investing activities . . . . . . . . . . . . . . . . (52,476) (5,247) (57,723) (51,210) (6,392) (57,602)
Cash flows from financing activities:
Payment of cash dividends . . . . . . . . . . . . . . . . . . . . . . . . . . . (133,462) — (133,462) — — —
Purchases of treasury shares. . . . . . . . . . . . . . . . . . . . . . . . . . (87,812) — (87,812) (156,036) — (156,036)
Proceeds from sales of shares upon exercise of
options and purchase rights . . . . . . . . . . . . . . . . . . . . . . . 15,982 — 15,982 17,591 — 17,591
Tax withholdings related to net share settlements of
restricted stock units . . . . . . . . . . . . . . . . . . . . . . . . . . . . (2,375) — (2,375) (966) — (966)
Excess tax benefits from share-based compensation . . . . . . 26 — 26 37 — 37
Net cash used in financing activities. . . . . . . . . . . . . . . . (207,641) — (207,641) (139,374) — (139,374)
Effect of exchange rate changes on cash and cash
equivalents. . . . . . . . . . . . . . . . . . . . . . . . . . . . . . . . . . . . . . . . (1,571) — (1,571) (5,119) — (5,119)
Net increase (decrease) in cash and
cash equivalents . . . . . . . . . . . . . . . . . . . . . . . . . . . . (144,546) — (144,546) 439 — 439
Cash and cash equivalents at beginning of period . . . . . . . . . . . . 478,370 — 478,370 477,931 — 477,931
Cash and cash equivalents at end of period. . . . . . . . . . . . . . . . . . $ 333,824 $ — $ 333,824 $ 478,370 $ — $ 478,370
Non-cash investing activities:
Property, plant and equipment purchased during the period
and included in period end liability accounts . . . . . . . . . $ 4,828 $ — $ 4,828 $ 5,454 $ — $ 5,454
Supplemental cash flow information:
Interest paid. . . . . . . . . . . . . . . . . . . . . . . . . . . . . . . . . . . . . . . $ 1,293 $ — $ 1,293 $ 110 $ — $ 110
Income taxes paid, net. . . . . . . . . . . . . . . . . . . . . . . . . . . . . . . $ 14,108 $ — $ 14,108 $ 14,422 $ — $ 14,422
Note 2 — Restatement and Revision of Previously Issued Consolidated Financial Statements (Continued)
ANNUAl REPORT
235