Logitech 2014 Annual Report Download - page 178
Download and view the complete annual report
Please find page 178 of the 2014 Logitech annual report below. You can navigate through the pages in the report by either clicking on the pages listed below, or by using the keyword search tool below to find specific information within the annual report.-
 1
1 -
2
-
3
-
4
-
5
-
6
-
7
-
8
-
9
-
10
-
11
-
12
-
13
-
14
-
15
-
16
-
17
-
18
-
19
-
20
-
21
-
22
-
23
-
24
-
25
-
26
-
27
-
28
-
29
-
30
-
31
-
32
-
33
-
34
-
35
-
36
-
37
-
38
-
39
-
40
-
41
-
42
-
43
-
44
-
45
-
46
-
47
-
48
-
49
-
50
-
51
-
52
-
53
-
54
-
55
-
56
-
57
-
58
-
59
-
60
-
61
-
62
-
63
-
64
-
65
-
66
-
67
-
68
-
69
-
70
-
71
-
72
-
73
-
74
-
75
-
76
-
77
-
78
-
79
-
80
-
81
-
82
-
83
-
84
-
85
-
86
-
87
-
88
-
89
-
90
-
91
-
92
-
93
-
94
-
95
-
96
-
97
-
98
-
99
-
100
-
101
-
102
-
103
-
104
-
105
-
106
-
107
-
108
-
109
-
110
-
111
-
112
-
113
-
114
-
115
-
116
-
117
-
118
-
119
-
120
-
121
-
122
-
123
-
124
-
125
-
126
-
127
-
128
-
129
-
130
-
131
-
132
-
133
-
134
-
135
-
136
-
137
-
138
-
139
-
140
-
141
-
142
-
143
-
144
-
145
-
146
-
147
-
148
-
149
-
150
-
151
-
152
-
153
-
154
-
155
-
156
-
157
-
158
-
159
-
160
-
161
-
162
-
163
-
164
-
165
-
166
-
167
-
 168
168 -
 169
169 -
 170
170 -
 171
171 -
 172
172 -
 173
173 -
 174
174 -
 175
175 -
 176
176 -
 177
177 -
 178
178 -
 179
179 -
 180
180 -
 181
181 -
 182
182 -
 183
183 -
 184
184 -
 185
185 -
 186
186 -
 187
187 -
 188
188 -
189
-
190
-
191
-
192
-
193
-
194
-
195
-
196
-
197
-
198
-
199
-
200
-
201
-
202
-
203
-
204
-
205
-
206
-
207
-
208
-
209
-
210
-
211
-
212
-
213
-
214
-
215
-
216
-
217
-
218
-
219
-
220
-
221
-
222
-
223
-
224
-
225
-
226
-
227
-
228
-
229
-
230
-
231
-
232
-
233
-
234
-
235
-
236
-
237
-
238
-
239
-
240
-
241
-
242
-
243
-
244
-
245
-
246
-
247
-
248
-
249
-
250
-
251
-
252
-
253
-
254
-
255
-
256
-
257
-
258
-
259
-
260
-
261
-
262
-
263
-
264
-
265
-
266
-
267
-
268
-
269
-
270
-
271
-
272
-
273
-
274
-
275
-
276
-
277
-
278
-
279
-
280
-
281
-
282
-
283
-
284
-
285
-
286
-
287
-
288
-
289
-
290
-
291
-
292
-
293
-
294
-
295
-
296
-
297
-
298
-
299
-
300
-
301
-
302
-
303
-
304
-
305
-
306
-
307
-
308
 |
 |
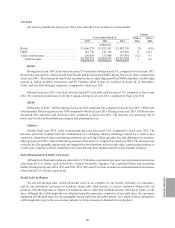
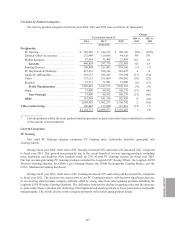
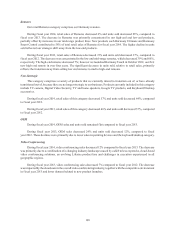
The decrease in total operating expenses during fiscal year 2014, compared to fiscal year 2013, was primarily
due to the $216.7 million impairment of goodwill and other assets recorded in fiscal year 2013, combined with the
restructuring plans initiated in fiscal year 2013, which reduced personnel-related expenses in fiscal year 2014 and
resulted in a $30.0 million decrease in restructuring expenses.
The increase in total operating expenses during fiscal year 2013, compared to fiscal year 2012, was mainly
due to the $216.7 million impairment charge of goodwill and other assets primarily related to the Lifesize business
and from the $43.7 million in costs related to restructuring plans we implemented in fiscal year 2013.
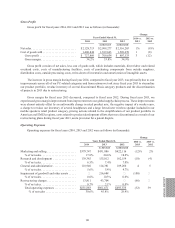
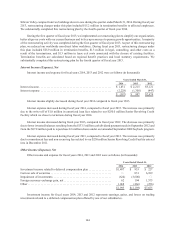
Marketing and Selling
Marketing and selling expense consists of personnel and related overhead costs, corporate and product
marketing, promotions, advertising, trade shows, customer and technical support and facilities costs.
During fiscal year 2014, marketing and selling expenses decreased 12%, compared to fiscal year 2013.
The decrease was primarily due to $15 million lower personnel-related expenses from the reduction in Lifesize
worldwide workforce restructuring and $24 million lower advertising and marketing cost related to the launch of
new Music category in fiscal year 2013.
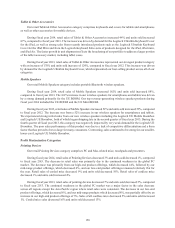
During fiscal year 2013, marketing and selling expense increased 2%, compared to fiscal year 2012. We
experienced increased advertising, product design, consulting and marketing expenses associated with the launch
of new music products, which were partially offset by decreases in personnel-related expense from restructuring
plans we implemented during fiscal year 2013, and reduction in Digital Home category marketing cost.
Research and Development
Research and development expense consists of personnel and related overhead costs, contractors and outside
consultants, supplies and materials, equipment depreciation and facilities costs, all associated with the design and
development of new products and enhancements of existing products.
During fiscal year 2014, research and development expense decreased 10%, compared to fiscal year 2013.
The decrease was primarily due to $6 million lower personnel-related expenses from the reduction in Lifesize
worldwide restructuring and $9 million lower design and development cost related to the fiscal year 2013 launch
of the new Music category.
During fiscal year 2013, research and development expense decreased 4%, compared to fiscal year 2012. The
decrease was primarily due to a decrease in personnel related expenses due to the reduction in worldwide workforce
resulting from our restructuring plans.
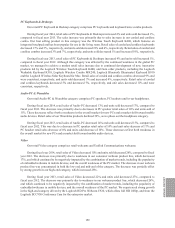
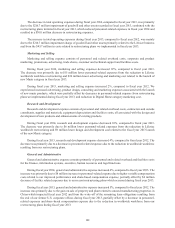
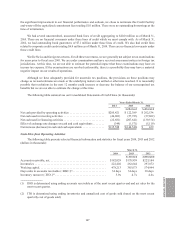
General and Administrative
General and administrative expense consists primarily of personnel and related overhead and facilities costs
for the finance, information systems, executive, human resources and legal functions.
During fiscal year 2014, general and administrative expense increased 4%, compared to fiscal year 2013. The
increase was primarily due to $8 million increase in personnel-related expense due to higher variable compensation
costs related to our improved performance and share-based compensation expense, partially offset by $4 million
decrease of facility related expenses due to our recent restructuring plans which occurred during fiscal year 2013.
During fiscal year 2013, general and administrative expense increased 5%, compared to fiscal year 2012. The
increase was primarily due to the gain on sale of property and plant related to unused manufacturing properties in
China which impacted fiscal year 2012 and from the write-off of the remaining lease obligations resulting from
the exit of our former U.S. corporate offices during fiscal year 2013, partially offset by a decrease in personnel-
related expenses and share-based compensation expense due to the reduction in worldwide workforce from our
restructuring plans during fiscal year 2013.
162