Logitech 2014 Annual Report Download - page 191
Download and view the complete annual report
Please find page 191 of the 2014 Logitech annual report below. You can navigate through the pages in the report by either clicking on the pages listed below, or by using the keyword search tool below to find specific information within the annual report.-
 1
1 -
2
-
3
-
4
-
5
-
6
-
7
-
8
-
9
-
10
-
11
-
12
-
13
-
14
-
15
-
16
-
17
-
18
-
19
-
20
-
21
-
22
-
23
-
24
-
25
-
26
-
27
-
28
-
29
-
30
-
31
-
32
-
33
-
34
-
35
-
36
-
37
-
38
-
39
-
40
-
41
-
42
-
43
-
44
-
45
-
46
-
47
-
48
-
49
-
50
-
51
-
52
-
53
-
54
-
55
-
56
-
57
-
58
-
59
-
60
-
61
-
62
-
63
-
64
-
65
-
66
-
67
-
68
-
69
-
70
-
71
-
72
-
73
-
74
-
75
-
76
-
77
-
78
-
79
-
80
-
81
-
82
-
83
-
84
-
85
-
86
-
87
-
88
-
89
-
90
-
91
-
92
-
93
-
94
-
95
-
96
-
97
-
98
-
99
-
100
-
101
-
102
-
103
-
104
-
105
-
106
-
107
-
108
-
109
-
110
-
111
-
112
-
113
-
114
-
115
-
116
-
117
-
118
-
119
-
120
-
121
-
122
-
123
-
124
-
125
-
126
-
127
-
128
-
129
-
130
-
131
-
132
-
133
-
134
-
135
-
136
-
137
-
138
-
139
-
140
-
141
-
142
-
143
-
144
-
145
-
146
-
147
-
148
-
149
-
150
-
151
-
152
-
153
-
154
-
155
-
156
-
157
-
158
-
159
-
160
-
161
-
162
-
163
-
164
-
165
-
166
-
167
-
168
-
169
-
170
-
171
-
172
-
173
-
174
-
175
-
176
-
177
-
178
-
179
-
180
-
 181
181 -
 182
182 -
 183
183 -
 184
184 -
 185
185 -
 186
186 -
 187
187 -
 188
188 -
 189
189 -
 190
190 -
 191
191 -
 192
192 -
 193
193 -
 194
194 -
 195
195 -
 196
196 -
 197
197 -
 198
198 -
 199
199 -
 200
200 -
 201
201 -
202
-
203
-
204
-
205
-
206
-
207
-
208
-
209
-
210
-
211
-
212
-
213
-
214
-
215
-
216
-
217
-
218
-
219
-
220
-
221
-
222
-
223
-
224
-
225
-
226
-
227
-
228
-
229
-
230
-
231
-
232
-
233
-
234
-
235
-
236
-
237
-
238
-
239
-
240
-
241
-
242
-
243
-
244
-
245
-
246
-
247
-
248
-
249
-
250
-
251
-
252
-
253
-
254
-
255
-
256
-
257
-
258
-
259
-
260
-
261
-
262
-
263
-
264
-
265
-
266
-
267
-
268
-
269
-
270
-
271
-
272
-
273
-
274
-
275
-
276
-
277
-
278
-
279
-
280
-
281
-
282
-
283
-
284
-
285
-
286
-
287
-
288
-
289
-
290
-
291
-
292
-
293
-
294
-
295
-
296
-
297
-
298
-
299
-
300
-
301
-
302
-
303
-
304
-
305
-
306
-
307
-
308
 |
 |

products were higher than the very modest sales. Retail sell-through in Americas region increased during the fiscal
quarter ended June 30, 2011 compared with the prior year. Foreign currency exchange rates had no effect on retail
sales in the region for the three months ended June 30, 2011.
Asia Pacific region’s retail sales grew 29% during the three months ended June 30, 2011 compared with the
same period in 2010, driven primarily by sales in China, which increased 89% compared with the prior year. All
product lines grew in the three months ended June 30, 2011 compared with the prior year quarter, except digital
home. Total retail units sold in the Asia Pacific region increased 31% during the quarter ended June 30, 2011
compared with the prior year. Retail sell-through during the quarter increased from the prior year in line with the
sales growth. If foreign currency exchange rates had been the same in the three months ended June 30, 2011 and
2010, our Asia Pacific constant dollar retail sales increase would have been 24%.
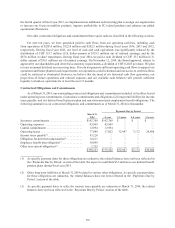
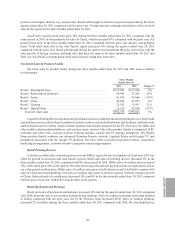
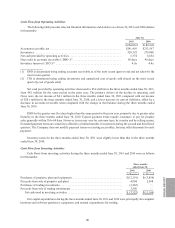
Net Retail Sales by Product Family
Net retail sales by product family during the three months ended June 30, 2011 and 2010 were as follows
(in thousands):
Three Months
Ended June 30,
Change %2011 2010
Retail—Pointing Devices . . . . . . . . . . . . . . . . . . . . . . . . . . . . . . . . . . . . . . . . $132,062 $131,846 0%
Retail—Keyboards & Desktops . . . . . . . . . . . . . . . . . . . . . . . . . . . . . . . . . . . 94,596 75,281 26%
Retail—Audio . . . . . . . . . . . . . . . . . . . . . . . . . . . . . . . . . . . . . . . . . . . . . . . . . 81,565 95,646 (15)%
Retail—Video . . . . . . . . . . . . . . . . . . . . . . . . . . . . . . . . . . . . . . . . . . . . . . . . . 49,845 47,057 6%
Retail—Gaming . . . . . . . . . . . . . . . . . . . . . . . . . . . . . . . . . . . . . . . . . . . . . . . 23,392 15,451 51%
Retail—Digital Home . . . . . . . . . . . . . . . . . . . . . . . . . . . . . . . . . . . . . . . . . . . 13,316 28,586 (53)%
Total net retail sales . . . . . . . . . . . . . . . . . . . . . . . . . . . . . . . . . . . . . . . . . $394,776 $393,867 0%
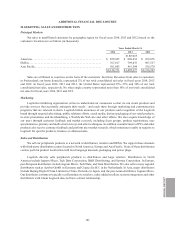
Logitech’s Pointing Devices product family includes our mice, trackballs and other pointing devices. Keyboards
and desktops (mouse and keyboard combined) include cordless and corded keyboards and desktops, and keyboards
and keyboard cases for tablets. Audio includes speakers and headset products for the PC, the home, the tablet and
other mobile entertainment platforms, and wireless music systems. Our video product family is comprised of PC
webcams and Alert video security systems. Gaming includes console and PC gaming peripherals. The Digital
Home product family combines our advanced Harmony Remote controls, Logitech Revue with Google TV, and
peripherals associated with the Google TV platform. Net sales reflect accruals for product returns, cooperative
marketing arrangements, customer incentive programs and pricing programs.
Retail Pointing Devices
A decline in dollar sales of pointing devices in our EMEA region for the first quarter of fiscal year 2012 was
offset by growth in Americas and Asia Pacific regions. Retail unit sales of pointing devices increased 9% in the
three months ended June 30, 2011 compared with the same period in 2010. Dollar sales of cordless mice increased
10%, while units grew 24% in the quarter. We achieved strong sales and unit growth in both our high-end as well as
our value-priced cordless mice. Dollar sales of cordless mice grew in both Americas and Asia Pacific regions, with
sales in China more than doubling. Unit sales of cordless mice grew in all three regions, with the strongest growth
in China. Sales and units of corded mice decreased 19% and 6% in the three months ended June 30, 2011 compared
with the prior fiscal year, with dollar sales declines in all regions.
Retail Keyboards and Desktops
Retail unit sales of keyboards and desktops increased 16% during the quarter ended June 30, 2011 compared
with 2010, primarily due to our cordless keyboards and desktops. Sales of cordless keyboards more than doubled
in dollars compared with the prior year, led by the Wireless Solar Keyboard K750. Sales of cordless desktops
increased 2% in dollars during the three months ended June 30, 2011 compared with 2010. We also launched our
ANNUAl REPORT
175