Logitech 2014 Annual Report Download - page 164
Download and view the complete annual report
Please find page 164 of the 2014 Logitech annual report below. You can navigate through the pages in the report by either clicking on the pages listed below, or by using the keyword search tool below to find specific information within the annual report.-
 1
1 -
2
-
3
-
4
-
5
-
6
-
7
-
8
-
9
-
10
-
11
-
12
-
13
-
14
-
15
-
16
-
17
-
18
-
19
-
20
-
21
-
22
-
23
-
24
-
25
-
26
-
27
-
28
-
29
-
30
-
31
-
32
-
33
-
34
-
35
-
36
-
37
-
38
-
39
-
40
-
41
-
42
-
43
-
44
-
45
-
46
-
47
-
48
-
49
-
50
-
51
-
52
-
53
-
54
-
55
-
56
-
57
-
58
-
59
-
60
-
61
-
62
-
63
-
64
-
65
-
66
-
67
-
68
-
69
-
70
-
71
-
72
-
73
-
74
-
75
-
76
-
77
-
78
-
79
-
80
-
81
-
82
-
83
-
84
-
85
-
86
-
87
-
88
-
89
-
90
-
91
-
92
-
93
-
94
-
95
-
96
-
97
-
98
-
99
-
100
-
101
-
102
-
103
-
104
-
105
-
106
-
107
-
108
-
109
-
110
-
111
-
112
-
113
-
114
-
115
-
116
-
117
-
118
-
119
-
120
-
121
-
122
-
123
-
124
-
125
-
126
-
127
-
128
-
129
-
130
-
131
-
132
-
133
-
134
-
135
-
136
-
137
-
138
-
139
-
140
-
141
-
142
-
143
-
144
-
145
-
146
-
147
-
148
-
149
-
150
-
151
-
152
-
153
-
 154
154 -
 155
155 -
 156
156 -
 157
157 -
 158
158 -
 159
159 -
 160
160 -
 161
161 -
 162
162 -
 163
163 -
 164
164 -
 165
165 -
 166
166 -
 167
167 -
 168
168 -
 169
169 -
 170
170 -
 171
171 -
 172
172 -
 173
173 -
 174
174 -
175
-
176
-
177
-
178
-
179
-
180
-
181
-
182
-
183
-
184
-
185
-
186
-
187
-
188
-
189
-
190
-
191
-
192
-
193
-
194
-
195
-
196
-
197
-
198
-
199
-
200
-
201
-
202
-
203
-
204
-
205
-
206
-
207
-
208
-
209
-
210
-
211
-
212
-
213
-
214
-
215
-
216
-
217
-
218
-
219
-
220
-
221
-
222
-
223
-
224
-
225
-
226
-
227
-
228
-
229
-
230
-
231
-
232
-
233
-
234
-
235
-
236
-
237
-
238
-
239
-
240
-
241
-
242
-
243
-
244
-
245
-
246
-
247
-
248
-
249
-
250
-
251
-
252
-
253
-
254
-
255
-
256
-
257
-
258
-
259
-
260
-
261
-
262
-
263
-
264
-
265
-
266
-
267
-
268
-
269
-
270
-
271
-
272
-
273
-
274
-
275
-
276
-
277
-
278
-
279
-
280
-
281
-
282
-
283
-
284
-
285
-
286
-
287
-
288
-
289
-
290
-
291
-
292
-
293
-
294
-
295
-
296
-
297
-
298
-
299
-
300
-
301
-
302
-
303
-
304
-
305
-
306
-
307
-
308
 |
 |
From time to time, we may seek to partner with, or acquire when appropriate, companies that have products,
personnel, and technologies that complement our strategic direction. We continually review our product offerings
and our strategic direction in light of our profitability targets, competitive conditions, changing consumer trends
and the evolving nature of the interface between the consumer and the digital world.
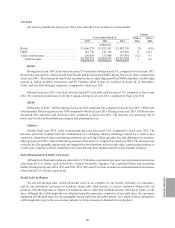
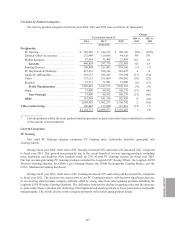
Summary of Financial Results
Our total net sales for fiscal year 2014 increased 1% in comparison to fiscal year 2013. Increases in our retail
sales were partially offset by decreases in video conferencing sales.
Retail sales during fiscal year 2014 increased 2% and units sold decreased 3%, compared to fiscal year 2013.
Retail sales increased 9% in Americas and 2% in Asia Pacific, partially offset by a decrease of 4% in EMEA. If
foreign currency exchange rates had been the same in fiscal year 2014 and 2013, the percentage changes in our
constant dollar retail sales would have been an increase of 1% for total retail sales, an increase of 9% in Americas,
an increase of 6% in the Asia Pacific, and a decrease of 7% in the EMEA regions.
OEM sales during fiscal year 2014 remained flat, compared to fiscal year 2013, with OEM sales of
$141.7 million during fiscal year 2014. OEM units sold remained flat during fiscal year 2014, compared to fiscal
year 2013.
Sales of Lifesize video conferencing products, which were 6% of total net sales during fiscal year 2014,
decreased 12% during fiscal year 2014, compared to fiscal year 2013, due to a combination of a changing industry
landscape caused by a shift to less expensive, cloud-based video conferencing solutions and, an evolving Lifesize
product line. During the second quarter of fiscal year 2014, we implemented a comprehensive restructuring at
Lifesize as part of our efforts to reposition the business and achieve profitability by the end of fiscal year 2014. This
restructuring included reduction in staffing as well as an exit from non-strategic product lines. This restructuring
resulted in a return to profitability in the third quarter of fiscal year 2014 before charges for amortization of
intangible assets, share based compensation, and restructuring. During fiscal year 2013, we recorded goodwill
impairment charges of $214.5 million related to our video conferencing reporting segment.
Our gross margin for fiscal year 2014 increased to 34.2%, compared to 33.8% for fiscal year 2013. The
increase in gross margin primarily resulted from cost improvements in some of our PC-related categories and from
actions we took during fiscal year 2013 to streamline our product portfolio.
Operating expenses for fiscal year 2014 were 30.6% of net sales, compared to 45.8% for fiscal year 2013. The
decrease in total operating expenses as a percentage of net sales was primarily due to a $216.7 million impairment
charge of goodwill and other assets during fiscal year 2013 and decreases of $29.9 million in restructuring charges
and $52.1 million in marketing and selling expenses due to headcount reductions as a result of restructuring and
lower sales and marketing investment in primarily music products.
Net income for fiscal year 2014 was $74.3 million, compared to a net loss of $227.5 million for fiscal year
2013. This improvement primarily resulted from a $216.7 million impairment charge of goodwill and other assets
related to our Lifesize business during fiscal year 2013 and decreases of $29.9 million in restructuring charges and
$52.1million in marketing and selling expenses, partially offset by a shift from a $25.8 million benefit from income
taxes for fiscal year 2013 to a $3.3 million provision for income taxes for fiscal year 2014.
Trends in Our Business
Our sales of PC peripherals for use by consumers in Americas and Europe have historically made up the large
majority of our revenues. In the last several years, the PC market has changed dramatically and there continues to
be significant weakness in the global market for new PCs. This weakness had a negative impact on our net sales
in all of our PC-related categories. We believe that this weakness reflects the growing popularity of tablets and
smartphones as mobile computing devices.
148