Logitech 2014 Annual Report Download - page 207
Download and view the complete annual report
Please find page 207 of the 2014 Logitech annual report below. You can navigate through the pages in the report by either clicking on the pages listed below, or by using the keyword search tool below to find specific information within the annual report.-
 1
1 -
2
-
3
-
4
-
5
-
6
-
7
-
8
-
9
-
10
-
11
-
12
-
13
-
14
-
15
-
16
-
17
-
18
-
19
-
20
-
21
-
22
-
23
-
24
-
25
-
26
-
27
-
28
-
29
-
30
-
31
-
32
-
33
-
34
-
35
-
36
-
37
-
38
-
39
-
40
-
41
-
42
-
43
-
44
-
45
-
46
-
47
-
48
-
49
-
50
-
51
-
52
-
53
-
54
-
55
-
56
-
57
-
58
-
59
-
60
-
61
-
62
-
63
-
64
-
65
-
66
-
67
-
68
-
69
-
70
-
71
-
72
-
73
-
74
-
75
-
76
-
77
-
78
-
79
-
80
-
81
-
82
-
83
-
84
-
85
-
86
-
87
-
88
-
89
-
90
-
91
-
92
-
93
-
94
-
95
-
96
-
97
-
98
-
99
-
100
-
101
-
102
-
103
-
104
-
105
-
106
-
107
-
108
-
109
-
110
-
111
-
112
-
113
-
114
-
115
-
116
-
117
-
118
-
119
-
120
-
121
-
122
-
123
-
124
-
125
-
126
-
127
-
128
-
129
-
130
-
131
-
132
-
133
-
134
-
135
-
136
-
137
-
138
-
139
-
140
-
141
-
142
-
143
-
144
-
145
-
146
-
147
-
148
-
149
-
150
-
151
-
152
-
153
-
154
-
155
-
156
-
157
-
158
-
159
-
160
-
161
-
162
-
163
-
164
-
165
-
166
-
167
-
168
-
169
-
170
-
171
-
172
-
173
-
174
-
175
-
176
-
177
-
178
-
179
-
180
-
181
-
182
-
183
-
184
-
185
-
186
-
187
-
188
-
189
-
190
-
191
-
192
-
193
-
194
-
195
-
196
-
 197
197 -
 198
198 -
 199
199 -
 200
200 -
 201
201 -
 202
202 -
 203
203 -
 204
204 -
 205
205 -
 206
206 -
 207
207 -
 208
208 -
 209
209 -
 210
210 -
 211
211 -
 212
212 -
 213
213 -
 214
214 -
 215
215 -
 216
216 -
 217
217 -
218
-
219
-
220
-
221
-
222
-
223
-
224
-
225
-
226
-
227
-
228
-
229
-
230
-
231
-
232
-
233
-
234
-
235
-
236
-
237
-
238
-
239
-
240
-
241
-
242
-
243
-
244
-
245
-
246
-
247
-
248
-
249
-
250
-
251
-
252
-
253
-
254
-
255
-
256
-
257
-
258
-
259
-
260
-
261
-
262
-
263
-
264
-
265
-
266
-
267
-
268
-
269
-
270
-
271
-
272
-
273
-
274
-
275
-
276
-
277
-
278
-
279
-
280
-
281
-
282
-
283
-
284
-
285
-
286
-
287
-
288
-
289
-
290
-
291
-
292
-
293
-
294
-
295
-
296
-
297
-
298
-
299
-
300
-
301
-
302
-
303
-
304
-
305
-
306
-
307
-
308
 |
 |

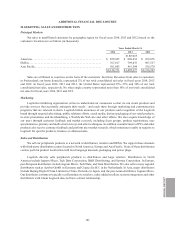
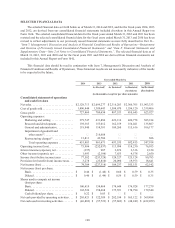
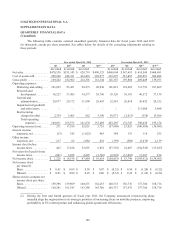
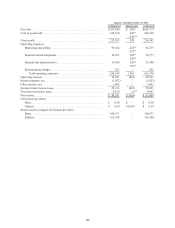
Year ended March 31, 2011 Year ended March 31, 2010
As Reported Adjustments As Restated As Reported Adjustments As Revised
(In thousands except for per share data) (In thousands except for per share data)
Consolidated statement
of operations and
cash flow data
Net sales....................... $2,366,765 $ — $ 2,366,765 $1,963,333 $ — $1,963,333
Cost of goods sold ............... 1,527,655 30,730(1) 1,556,120 1,339,099 — 1,339,406
(715)(2) 476(2)
(1,294)(3) —
(256)(4) (169)(4)
Gross profit .................... 839,110 (28,465) 810,645 624,234 (307) 623,927
Operating expenses:
Marketing and selling ........ 420,580 (695)(2) 420,778 304,674 462(2) 305,184
893(4) 48(4)
Research and development .... 156,770 (570)(2) 156,021 135,681 379(2) 135,867
(179)(4) (193)(4)
General and administrative.... 116,042 (376)(2) 115,616 105,927 250(2) 106,177
(50)(4) —
Restructuring charges ........ — — — 686 — 686
Total operating expenses .... 693,392 (977) 692,415 546,968 946 547,914
Operating income ............... 145,718 (27,488) 118,230 77,266 (1,253) 76,013
Interest income, net .............. 2,316 — 2,316 2,120 — 2,120
Other income, net ............... 3,127 1,451(4) 4,578 2,650 — 2,650
Income before income taxes ....... 151,161 (26,037) 125,124 82,036 (1,253) 80,783
Provision for income taxes ........ 19,988 (15)(4) 19,973 18,666 (25)(4) 18,641
Net income..................... 131,173 (26,022) 105,151 63,370 (1,228) 62,142
Net income per share:
Basic....................... $ 0.74 $ (0.15) $ 0.59 $ 0.36 $ (0.01) $ 0.35
Diluted ..................... $ 0.73 $ (0.14) $ 0.59 $ 0.35 $ — $ 0.35
Shares used to compute net income
per share:
Basic....................... 176,928 — 176,928 177,279 — 177,279
Diluted ..................... 178,790 — 178,790 179,340 — 179,340
Net cash provided by operating
activities .................... $ 156,742 $ 8,380(2) $ 165,122 $ 365,259 $ 4,229(2) $ 369,488
Net cash used in investing
activities .................... $ (39,861) $ (8,380)(2) $ (48,241) $ (427,830) $(4,229)(2) $ (432,059)
ANNUAl REPORT
191