Logitech 2014 Annual Report Download - page 177
Download and view the complete annual report
Please find page 177 of the 2014 Logitech annual report below. You can navigate through the pages in the report by either clicking on the pages listed below, or by using the keyword search tool below to find specific information within the annual report.-
 1
1 -
2
-
3
-
4
-
5
-
6
-
7
-
8
-
9
-
10
-
11
-
12
-
13
-
14
-
15
-
16
-
17
-
18
-
19
-
20
-
21
-
22
-
23
-
24
-
25
-
26
-
27
-
28
-
29
-
30
-
31
-
32
-
33
-
34
-
35
-
36
-
37
-
38
-
39
-
40
-
41
-
42
-
43
-
44
-
45
-
46
-
47
-
48
-
49
-
50
-
51
-
52
-
53
-
54
-
55
-
56
-
57
-
58
-
59
-
60
-
61
-
62
-
63
-
64
-
65
-
66
-
67
-
68
-
69
-
70
-
71
-
72
-
73
-
74
-
75
-
76
-
77
-
78
-
79
-
80
-
81
-
82
-
83
-
84
-
85
-
86
-
87
-
88
-
89
-
90
-
91
-
92
-
93
-
94
-
95
-
96
-
97
-
98
-
99
-
100
-
101
-
102
-
103
-
104
-
105
-
106
-
107
-
108
-
109
-
110
-
111
-
112
-
113
-
114
-
115
-
116
-
117
-
118
-
119
-
120
-
121
-
122
-
123
-
124
-
125
-
126
-
127
-
128
-
129
-
130
-
131
-
132
-
133
-
134
-
135
-
136
-
137
-
138
-
139
-
140
-
141
-
142
-
143
-
144
-
145
-
146
-
147
-
148
-
149
-
150
-
151
-
152
-
153
-
154
-
155
-
156
-
157
-
158
-
159
-
160
-
161
-
162
-
163
-
164
-
165
-
166
-
 167
167 -
 168
168 -
 169
169 -
 170
170 -
 171
171 -
 172
172 -
 173
173 -
 174
174 -
 175
175 -
 176
176 -
 177
177 -
 178
178 -
 179
179 -
 180
180 -
 181
181 -
 182
182 -
 183
183 -
 184
184 -
 185
185 -
 186
186 -
 187
187 -
188
-
189
-
190
-
191
-
192
-
193
-
194
-
195
-
196
-
197
-
198
-
199
-
200
-
201
-
202
-
203
-
204
-
205
-
206
-
207
-
208
-
209
-
210
-
211
-
212
-
213
-
214
-
215
-
216
-
217
-
218
-
219
-
220
-
221
-
222
-
223
-
224
-
225
-
226
-
227
-
228
-
229
-
230
-
231
-
232
-
233
-
234
-
235
-
236
-
237
-
238
-
239
-
240
-
241
-
242
-
243
-
244
-
245
-
246
-
247
-
248
-
249
-
250
-
251
-
252
-
253
-
254
-
255
-
256
-
257
-
258
-
259
-
260
-
261
-
262
-
263
-
264
-
265
-
266
-
267
-
268
-
269
-
270
-
271
-
272
-
273
-
274
-
275
-
276
-
277
-
278
-
279
-
280
-
281
-
282
-
283
-
284
-
285
-
286
-
287
-
288
-
289
-
290
-
291
-
292
-
293
-
294
-
295
-
296
-
297
-
298
-
299
-
300
-
301
-
302
-
303
-
304
-
305
-
306
-
307
-
308
 |
 |

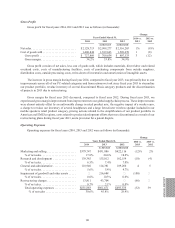
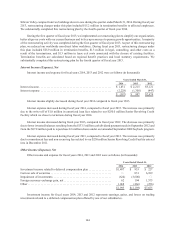
Gross Profit
Gross profit for fiscal years 2014, 2013 and 2012 was as follows (in thousands):
Years Ended March 31,
Change
2014 vs.
2013
2013 vs.
20122014 2013 2012
As Revised As Restated
Net sales............................... $2,128,713 $2,099,277 $2,316,203 1% (9)%
Cost of goods sold ....................... 1,400,844 1,389,643 1,508,670 1 (8)
Gross profit ......................... $ 727,869 $ 709,634 $ 807,533 3 (12)
Gross margin ........................ 34.2% 33.8% 34.9%
Gross profit consists of net sales, less cost of goods sold, which includes materials, direct labor and related
overhead costs, costs of manufacturing facilities, costs of purchasing components from outside suppliers,
distribution costs, outside processing costs, write-down of inventories and amortization of intangible assets.
The increase in gross margin during fiscal year 2014, compared to fiscal year 2013, was primarily due to cost
improvements across all of our PC-related categories and from actions we took since fiscal year 2013 to streamline
our product portfolio, revalue inventory of several discontinued Music category products and the discontinuation
of projects in 2013 due to restructuring.
Gross margin for fiscal year 2013 decreased, compared to fiscal year 2012. During fiscal year 2013, we
experienced gross margin improvement from improvements to our global supply chain process. These improvements
were almost entirely offset by an unfavorable change in retail product mix, the negative impact of a weaker euro,
a charge to revalue our inventory of several headphones and a large form-factor wireless speaker included in our
mobile speakers retail product category, pricing actions related to the simplification of our product portfolio in
Americas and EMEA regions, costs related to product development efforts that were discontinued as a result of our
restructuring plans during fiscal year 2013, and a provision for a patent dispute.
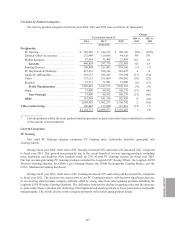
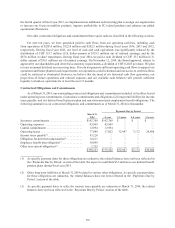
Operating Expenses
Operating expenses for fiscal years 2014, 2013 and 2012 were as follows (in thousands):
Years Ended March 31,
Change
2014 vs.
2013
2013 vs.
20122014 2013 2012
As Revised As Restated
Marketing and selling . . . . . . . . . . . . . . . . . . . . $379,747 $431,886 $422,116 (12)% 2%
% of net sales . . . . . . . . . . . . . . . . . . . . . . . . 17.8% 20.6% 18.2%
Research and development . . . . . . . . . . . . . . . . 139,385 155,012 162,159 (10) (4)
% of net sales . . . . . . . . . . . . . . . . . . . . . . . . 6.5% 7.4% 7.0%
General and administrative . . . . . . . . . . . . . . . . 118,940 114,381 109,260 4 5
% of net sales . . . . . . . . . . . . . . . . . . . . . . . . 5.6% 5.4% 4.7%
Impairment of goodwill and other assets . . . . . — 216,688 — (100) —
% of net sales . . . . . . . . . . . . . . . . . . . . . . . . 0.0% 10.3% 0.0%
Restructuring charges . . . . . . . . . . . . . . . . . . . . 13,811 43,704 — (68) —
% of net sales . . . . . . . . . . . . . . . . . . . . . . . . 0.7% 2.1 % 0.0%
Total operating expenses . . . . . . . . . . . . . . . $651,883 $961,671 $693,535 (32) 39
% of net sales . . . . . . . . . . . . . . . . . . . . . 30.6% 45.8% 29.9%
ANNUAl REPORT
161