Logitech 2014 Annual Report Download - page 130
Download and view the complete annual report
Please find page 130 of the 2014 Logitech annual report below. You can navigate through the pages in the report by either clicking on the pages listed below, or by using the keyword search tool below to find specific information within the annual report.-
 1
1 -
2
-
3
-
4
-
5
-
6
-
7
-
8
-
9
-
10
-
11
-
12
-
13
-
14
-
15
-
16
-
17
-
18
-
19
-
20
-
21
-
22
-
23
-
24
-
25
-
26
-
27
-
28
-
29
-
30
-
31
-
32
-
33
-
34
-
35
-
36
-
37
-
38
-
39
-
40
-
41
-
42
-
43
-
44
-
45
-
46
-
47
-
48
-
49
-
50
-
51
-
52
-
53
-
54
-
55
-
56
-
57
-
58
-
59
-
60
-
61
-
62
-
63
-
64
-
65
-
66
-
67
-
68
-
69
-
70
-
71
-
72
-
73
-
74
-
75
-
76
-
77
-
78
-
79
-
80
-
81
-
82
-
83
-
84
-
85
-
86
-
87
-
88
-
89
-
90
-
91
-
92
-
93
-
94
-
95
-
96
-
97
-
98
-
99
-
100
-
101
-
102
-
103
-
104
-
105
-
106
-
107
-
108
-
109
-
110
-
111
-
112
-
113
-
114
-
115
-
116
-
117
-
118
-
119
-
 120
120 -
 121
121 -
 122
122 -
 123
123 -
 124
124 -
 125
125 -
 126
126 -
 127
127 -
 128
128 -
 129
129 -
 130
130 -
 131
131 -
 132
132 -
 133
133 -
 134
134 -
 135
135 -
 136
136 -
 137
137 -
 138
138 -
 139
139 -
 140
140 -
141
-
142
-
143
-
144
-
145
-
146
-
147
-
148
-
149
-
150
-
151
-
152
-
153
-
154
-
155
-
156
-
157
-
158
-
159
-
160
-
161
-
162
-
163
-
164
-
165
-
166
-
167
-
168
-
169
-
170
-
171
-
172
-
173
-
174
-
175
-
176
-
177
-
178
-
179
-
180
-
181
-
182
-
183
-
184
-
185
-
186
-
187
-
188
-
189
-
190
-
191
-
192
-
193
-
194
-
195
-
196
-
197
-
198
-
199
-
200
-
201
-
202
-
203
-
204
-
205
-
206
-
207
-
208
-
209
-
210
-
211
-
212
-
213
-
214
-
215
-
216
-
217
-
218
-
219
-
220
-
221
-
222
-
223
-
224
-
225
-
226
-
227
-
228
-
229
-
230
-
231
-
232
-
233
-
234
-
235
-
236
-
237
-
238
-
239
-
240
-
241
-
242
-
243
-
244
-
245
-
246
-
247
-
248
-
249
-
250
-
251
-
252
-
253
-
254
-
255
-
256
-
257
-
258
-
259
-
260
-
261
-
262
-
263
-
264
-
265
-
266
-
267
-
268
-
269
-
270
-
271
-
272
-
273
-
274
-
275
-
276
-
277
-
278
-
279
-
280
-
281
-
282
-
283
-
284
-
285
-
286
-
287
-
288
-
289
-
290
-
291
-
292
-
293
-
294
-
295
-
296
-
297
-
298
-
299
-
300
-
301
-
302
-
303
-
304
-
305
-
306
-
307
-
308
 |
 |

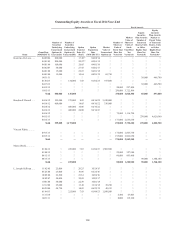
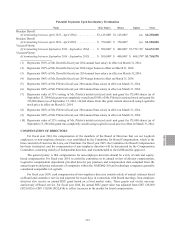
Outstanding Equity Awards at Fiscal 2014 Year-End
Option Awards Stock Awards
Name
Grant Date
(MM/DD/YY)
Number of
Securities
Underlying
Unexercised
Options (#)
Exercisable
Number of
Securities
Underlying
Unexercised
Options (#)
Unexercisable
Option
Exercise
Price ($) /
Share
Option
Expiration
Date
(MM/DD/YY)
Market
Value of
Unexercised
Options ($)
Number of
Shares or
Units of
Stock That
Have Not
Vested (#)
Market
Value of
Shares or
Units of
Stock
That Have
Not
Vested ($)
Equity
Incentive
Plan Awards:
Number of
Unearned
Shares, Units
or Other
Rights That
Have Not
Vested (#)
Equity
Incentive
Plan Awards:
Market or
Payout Value
of Unearned
Shares, Units
or Other
Rights That
Have Not
Vested ($)(1)
Guerrino De Luca . . . . 04/08/04 200,000 — 17.20(2) 04/08/14 — — — — —
04/01/05 200,000 — 20.97(3) 04/01/15 — — — — —
04/01/06 100,000 — 20.05 04/01/16 — — — — —
04/02/07 50,000 — 27.95 04/02/17 — — — — —
04/01/08 15,000 — 26.67 04/01/18 — — — — —
04/01/09 15,000 — 10.64 04/01/19 63,750 — — — —
04/11/11 — — — — — — — 30,000 446,700
01/04/13 — 130,000 7.83 01/04/23 917,800 — — — —
04/15/13 — — — — — — — 30,000 446,700
04/15/13 — — — — — 20,000 297,800 — —
10/15/13 — — — — — 250,000 3,722,500 — —
Total 580,000 130,000 270,000 4,020,300 60,000 893,400
Bracken P. Darrell . . . 04/16/12 125,000 375,000 8.03 04/16/22 3,430,000 — — — —
04/16/12 400,000 — 14.05 04/16/22 336,000 — — — —
04/16/12 — 400,000 16.06 04/16/22 — — — — —
04/16/12 — 400,000 20.08 04/16/22 — — — — —
04/16/12 — — — — — 75,000 1,116,750 — —
04/15/13 — — — — — — — 270,000 4,020,300
04/15/13 — — — — — 177,000 2,635,530 — —
Total 525,000 1,175,000 252,000 3,752,280 270,000 4,020,300
Vincent Pilette . . . . . .
09/15/13 — — — — — 175,000 2,605,750 — —
09/15/13 — — — — — 195,000 2,903,550 — —
Total — — — — — 370,000 5,509,300 — —
Marcel Stolk . . . . . . . .
01/04/13 — 225,000 7.83 01/04/23 1,588,500 — — — —
01/04/13 — — — — — 22,000 327,580 — —
04/15/13 — — — — — 60,000 893,400 — —
04/15/13 — — — — — — — 90,000 1,340,100
Total — 225,000 82,000 1,220,980 90,000 1,340,100
L. Joseph Sullivan . . . 11/02/05 25,000 — 20.25 10/24/15 — — — — —
03/23/06 25,000 — 19.96 03/23/16 — — — — —
10/02/06 22,500 — 21.61 10/02/16 — — — — —
10/02/07 50,000 — 30.09 10/02/17 — — — — —
10/01/08 50,000 — 22.59 10/01/18 — — — — —
12/12/08 25,000 — 13.48 12/12/18 35,250 — — — —
06/29/09 48,750 — 14.02 06/29/19 42,413 — — — —
01/04/13 — 225,000 7.83 01/04/23 1,588,500 — — — —
11/15/10 — — — — — 4,500 67,005 — —
04/11/11 — — — — — 8,000 119,120 — —
114