Logitech 2014 Annual Report Download - page 182
Download and view the complete annual report
Please find page 182 of the 2014 Logitech annual report below. You can navigate through the pages in the report by either clicking on the pages listed below, or by using the keyword search tool below to find specific information within the annual report.-
 1
1 -
2
-
3
-
4
-
5
-
6
-
7
-
8
-
9
-
10
-
11
-
12
-
13
-
14
-
15
-
16
-
17
-
18
-
19
-
20
-
21
-
22
-
23
-
24
-
25
-
26
-
27
-
28
-
29
-
30
-
31
-
32
-
33
-
34
-
35
-
36
-
37
-
38
-
39
-
40
-
41
-
42
-
43
-
44
-
45
-
46
-
47
-
48
-
49
-
50
-
51
-
52
-
53
-
54
-
55
-
56
-
57
-
58
-
59
-
60
-
61
-
62
-
63
-
64
-
65
-
66
-
67
-
68
-
69
-
70
-
71
-
72
-
73
-
74
-
75
-
76
-
77
-
78
-
79
-
80
-
81
-
82
-
83
-
84
-
85
-
86
-
87
-
88
-
89
-
90
-
91
-
92
-
93
-
94
-
95
-
96
-
97
-
98
-
99
-
100
-
101
-
102
-
103
-
104
-
105
-
106
-
107
-
108
-
109
-
110
-
111
-
112
-
113
-
114
-
115
-
116
-
117
-
118
-
119
-
120
-
121
-
122
-
123
-
124
-
125
-
126
-
127
-
128
-
129
-
130
-
131
-
132
-
133
-
134
-
135
-
136
-
137
-
138
-
139
-
140
-
141
-
142
-
143
-
144
-
145
-
146
-
147
-
148
-
149
-
150
-
151
-
152
-
153
-
154
-
155
-
156
-
157
-
158
-
159
-
160
-
161
-
162
-
163
-
164
-
165
-
166
-
167
-
168
-
169
-
170
-
171
-
 172
172 -
 173
173 -
 174
174 -
 175
175 -
 176
176 -
 177
177 -
 178
178 -
 179
179 -
 180
180 -
 181
181 -
 182
182 -
 183
183 -
 184
184 -
 185
185 -
 186
186 -
 187
187 -
 188
188 -
 189
189 -
 190
190 -
 191
191 -
 192
192 -
193
-
194
-
195
-
196
-
197
-
198
-
199
-
200
-
201
-
202
-
203
-
204
-
205
-
206
-
207
-
208
-
209
-
210
-
211
-
212
-
213
-
214
-
215
-
216
-
217
-
218
-
219
-
220
-
221
-
222
-
223
-
224
-
225
-
226
-
227
-
228
-
229
-
230
-
231
-
232
-
233
-
234
-
235
-
236
-
237
-
238
-
239
-
240
-
241
-
242
-
243
-
244
-
245
-
246
-
247
-
248
-
249
-
250
-
251
-
252
-
253
-
254
-
255
-
256
-
257
-
258
-
259
-
260
-
261
-
262
-
263
-
264
-
265
-
266
-
267
-
268
-
269
-
270
-
271
-
272
-
273
-
274
-
275
-
276
-
277
-
278
-
279
-
280
-
281
-
282
-
283
-
284
-
285
-
286
-
287
-
288
-
289
-
290
-
291
-
292
-
293
-
294
-
295
-
296
-
297
-
298
-
299
-
300
-
301
-
302
-
303
-
304
-
305
-
306
-
307
-
308
 |
 |
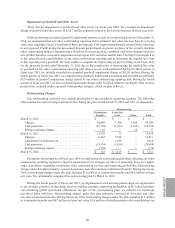
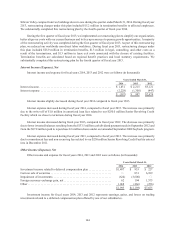
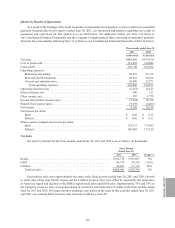
As of March 31, 2014, we had $93.1 million in non-current income taxes payable and $0.3 million in current
income taxes payable, including interest and penalties, related to our income tax liability for uncertain tax positions.
As of March 31, 2013, we had $98.8 million in non-current income taxes payable.
We continue to recognize interest and penalties related to unrecognized tax positions in income tax expense.
We recognized $1.1 million, $1.0 million and $1.2 million in interest and penalties in income tax expense during
fiscal years 2014, 2013 and 2012, respectively. As of March 31, 2014, 2013 and 2012, we had approximately
$5.6 million, $6.6 million and $7.5 million of accrued interest and penalties related to uncertain tax positions.
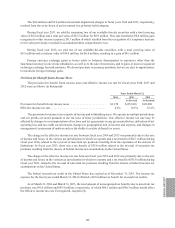
We file Swiss and foreign tax returns. For all these tax returns, we are generally not subject to tax examinations
for years prior to fiscal year 2001. We are under examination and have received assessment notices in foreign tax
jurisdictions. At this time, we are not able to estimate the potential impact that these examinations may have on
income tax expense. If the examinations are resolved unfavorably, there is a possibility they may have a material
negative impact on our results of operations.
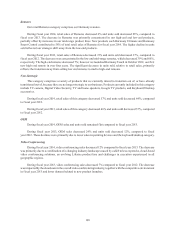
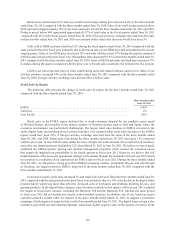
Liquidity and Capital Resources
Cash Balances, Available Borrowings, and Capital Resources
As of March 31, 2014, we had cash and cash equivalents of $469.4 million, compared with $333.8 million at
March 31, 2013. Our cash and cash equivalents consist of bank demand deposits and short-term time deposits of
which 73% is held by our Swiss-based entities and 12% is held by our subsidiaries in Hong Kong and China. We
do not expect to incur any material adverse tax impact or be significantly inhibited by any country in which we do
business from the repatriation of funds to Switzerland, our home domicile.
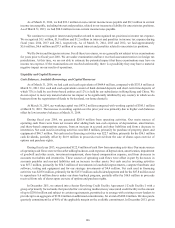
At March 31, 2014, our working capital was $478.2 million compared with working capital of $385.1 million
at March 31, 2013. The increase in working capital over the prior year was primarily due to higher cash balances
offset by low inventory balances at March 31, 2014.
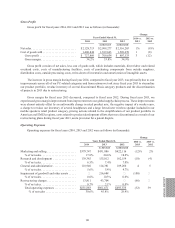
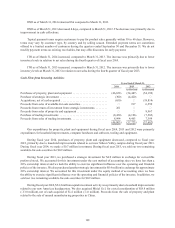
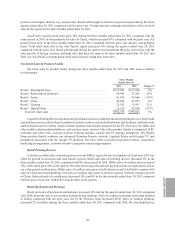
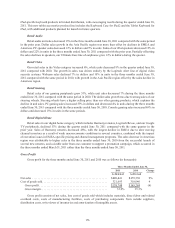
During fiscal year 2014, we generated $205.4 million from operating activities. Our main sources of
operating cash flows were from net income after adding back non-cash expenses of depreciation, amortization,
and share-based compensation expense, from an increase in accrued and other liabilities and from a decrease in
inventories. Net cash used in investing activities was $46.8 million, primarily for purchase of property, plant, and
equipment of $46.7 million. Net cash used in financing activities was $22.7 million, primarily for the $36.1 million
cash dividends, partially offset by $16.9 million in proceeds received from the sale of shares upon exercise of
options and purchase rights.
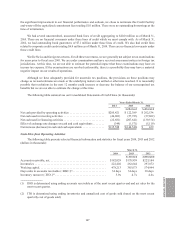
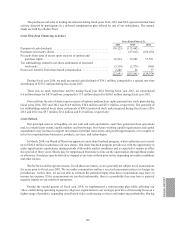
During fiscal year 2013, we generated $122.4 million of cash flow from operating activities. Our main sources
of operating cash flows were net loss after adding back non-cash expenses of depreciation, amortization, impairment
of goodwill and other assets, investment impairment, share-based compensation expense, and from decreases in
accounts receivables and inventories. These sources of operating cash flows were offset in part by decreases in
accounts payables and accrued liabilities and an increase in other assets. Net cash used in investing activities
was $57.7 million, primarily for $54.5 million of investments in leasehold improvements, computer hardware and
software, tooling and equipment and for our strategic investments of $4.4 million. Net cash used in financing
activities was $207.6 million, primarily for the $133.5 million cash dividend payment and for the $87.8 million used
to repurchase 8.6 million shares under our share buyback program, partially offset by $16.0 million in proceeds
received from sale of shares upon exercise of options and purchase rights.
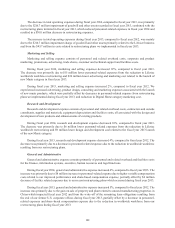
In December 2011, we entered into a Senior Revolving Credit Facility Agreement (“Credit Facility”) with a
group of primarily Swiss banks that provided for a revolving multicurrency unsecured credit facility in the amount
of up to $250.0 million and subject to certain requirements, permitted us to arrange with existing or new lenders to
provide up to an aggregate of $150.0 million in additional commitments, for a total of $400.0 million. We also paid a
quarterly commitment fee of 40% of the applicable margin on the available commitment. In December 2013, given
166