Logitech 2014 Annual Report Download - page 172
Download and view the complete annual report
Please find page 172 of the 2014 Logitech annual report below. You can navigate through the pages in the report by either clicking on the pages listed below, or by using the keyword search tool below to find specific information within the annual report.-
 1
1 -
2
-
3
-
4
-
5
-
6
-
7
-
8
-
9
-
10
-
11
-
12
-
13
-
14
-
15
-
16
-
17
-
18
-
19
-
20
-
21
-
22
-
23
-
24
-
25
-
26
-
27
-
28
-
29
-
30
-
31
-
32
-
33
-
34
-
35
-
36
-
37
-
38
-
39
-
40
-
41
-
42
-
43
-
44
-
45
-
46
-
47
-
48
-
49
-
50
-
51
-
52
-
53
-
54
-
55
-
56
-
57
-
58
-
59
-
60
-
61
-
62
-
63
-
64
-
65
-
66
-
67
-
68
-
69
-
70
-
71
-
72
-
73
-
74
-
75
-
76
-
77
-
78
-
79
-
80
-
81
-
82
-
83
-
84
-
85
-
86
-
87
-
88
-
89
-
90
-
91
-
92
-
93
-
94
-
95
-
96
-
97
-
98
-
99
-
100
-
101
-
102
-
103
-
104
-
105
-
106
-
107
-
108
-
109
-
110
-
111
-
112
-
113
-
114
-
115
-
116
-
117
-
118
-
119
-
120
-
121
-
122
-
123
-
124
-
125
-
126
-
127
-
128
-
129
-
130
-
131
-
132
-
133
-
134
-
135
-
136
-
137
-
138
-
139
-
140
-
141
-
142
-
143
-
144
-
145
-
146
-
147
-
148
-
149
-
150
-
151
-
152
-
153
-
154
-
155
-
156
-
157
-
158
-
159
-
160
-
161
-
 162
162 -
 163
163 -
 164
164 -
 165
165 -
 166
166 -
 167
167 -
 168
168 -
 169
169 -
 170
170 -
 171
171 -
 172
172 -
 173
173 -
 174
174 -
 175
175 -
 176
176 -
 177
177 -
 178
178 -
 179
179 -
 180
180 -
 181
181 -
 182
182 -
183
-
184
-
185
-
186
-
187
-
188
-
189
-
190
-
191
-
192
-
193
-
194
-
195
-
196
-
197
-
198
-
199
-
200
-
201
-
202
-
203
-
204
-
205
-
206
-
207
-
208
-
209
-
210
-
211
-
212
-
213
-
214
-
215
-
216
-
217
-
218
-
219
-
220
-
221
-
222
-
223
-
224
-
225
-
226
-
227
-
228
-
229
-
230
-
231
-
232
-
233
-
234
-
235
-
236
-
237
-
238
-
239
-
240
-
241
-
242
-
243
-
244
-
245
-
246
-
247
-
248
-
249
-
250
-
251
-
252
-
253
-
254
-
255
-
256
-
257
-
258
-
259
-
260
-
261
-
262
-
263
-
264
-
265
-
266
-
267
-
268
-
269
-
270
-
271
-
272
-
273
-
274
-
275
-
276
-
277
-
278
-
279
-
280
-
281
-
282
-
283
-
284
-
285
-
286
-
287
-
288
-
289
-
290
-
291
-
292
-
293
-
294
-
295
-
296
-
297
-
298
-
299
-
300
-
301
-
302
-
303
-
304
-
305
-
306
-
307
-
308
 |
 |
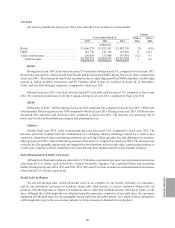
Americas
During fiscal year 2014, retail sales in Americas increased 9%, compared to fiscal year 2013. Retail sales
increased in Tablet & Other Accessories, Mobile speakers, PC Gaming, PC Keyboards & Desktops and Pointing
Devices, partially offset by decreases in Non-Strategic Other, Audio-PC & Wearables, Remotes, and Video. The
increase in Tablet & Other Accessories was led by sales of our Ultrathin Keyboard Cover for the iPad and from our
recently introduced Keyboard Folio suite of products designed for the iPad, iPad mini and iPad Air. The increase
in Mobile Speakers was primarily from the UE BOOM. The increase in PC Gaming was due to the recent launch
of our new gaming products. The increase in PC Keyboards & Desktops was driven by low-end, mid-range and
high-end products. Retail sales improved in the United States and Canada during fiscal year 2014, compared to
fiscal year 2013. In addition, retail sell-through increased 9% during fiscal year 2014, compared to fiscal year 2013.
During fiscal year 2013, Americas decreased 7%, compared to fiscal year 2012. This decrease was primarily
from significant decreases in our Non-Strategic Other, Video, Pointing Devices, Audio- PC & Wearables, Remotes
and PC Gaming, partially offset by an increase in Tablets & Other Accessories, due to demand from the Logitech
Ultrathin Keyboard Cover for the iPad and slight increases in PC Keyboards & Desktops and Mobile Speakers.
During fiscal year 2013, we experienced weakness primarily in the United States, partially offset by improvements
in Mexico and Brazil. In addition, retail sell-through decreased 5% during fiscal year 2013, compared to fiscal
year 2012.
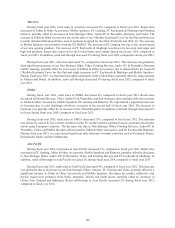
EMEA
During fiscal year 2014, retail sales in EMEA decreased 4%, compared to fiscal year 2013. Retail sales
decreased in Pointing Devices, Video, Audio-PC & Wearables, and Non-Strategic other, partially offset by increases
in Tablet & Other Accessories, Mobile Speakers, PC Gaming and Remotes. We experienced a significant decrease
in Germany due to sales challenges which we overcame in the second half of fiscal year 2014. The decrease in
Germany was partially offset by an increase in the United Kingdom. In addition, retail sell-through decreased 4%
in Euros during fiscal year 2014, compared to fiscal year 2013.
During fiscal year 2013, retail sales in EMEA decreased 11%, compared to fiscal year 2012. The decrease
was primarily caused by the extreme weakness in the PC market and the continued macro-economic uncertainty
across many European countries. The decrease was due to Non-Strategic Other, Pointing Devices, Audio-PC &
Wearables, Video, and Mobile Speakers offset in part by Tablet & Other Accessories, and PC Keyboard & Desktops.
During fiscal year 2013, we experienced significant sales decreases in major countries such as Germany, France,
Switzerland, Spain, and the Netherlands.
Asia Pacific
During fiscal year 2014, retail sales in Asia Pacific increased 2%, compared to fiscal year 2013. Retail sales
increased in PC Gaming, Tablet & Other Accessories, Mobile Speakers and Remotes, partially offset by decreases
in Non-Strategic Other, Audio- PC & Wearables, Video, and Pointing Devices and PC keyboards & Desktops. In
addition, retail sell-through in Asia Pacific increased 2% during fiscal year 2014, compared to fiscal year 2013.
During fiscal year 2013, retail sales in Asia Pacific decreased 4%, compared to fiscal year 2012. This decrease
was primarily due to decreases in our Non-Strategic Other, remotes, PC Gaming and Video, partially offset by a
significant increase in Tablet & Other Accessories and Mobile Speakers. Decreases by country within the Asia
Pacific region were primarily from India, Australia, Taiwan and South Korea, partially offset by increases in
China, New Zealand and Indonesia. Retail sell-through in Asia Pacific increased 2% during fiscal year 2013,
compared to fiscal year 2012.
156