Logitech 2014 Annual Report Download - page 213
Download and view the complete annual report
Please find page 213 of the 2014 Logitech annual report below. You can navigate through the pages in the report by either clicking on the pages listed below, or by using the keyword search tool below to find specific information within the annual report.-
 1
1 -
2
-
3
-
4
-
5
-
6
-
7
-
8
-
9
-
10
-
11
-
12
-
13
-
14
-
15
-
16
-
17
-
18
-
19
-
20
-
21
-
22
-
23
-
24
-
25
-
26
-
27
-
28
-
29
-
30
-
31
-
32
-
33
-
34
-
35
-
36
-
37
-
38
-
39
-
40
-
41
-
42
-
43
-
44
-
45
-
46
-
47
-
48
-
49
-
50
-
51
-
52
-
53
-
54
-
55
-
56
-
57
-
58
-
59
-
60
-
61
-
62
-
63
-
64
-
65
-
66
-
67
-
68
-
69
-
70
-
71
-
72
-
73
-
74
-
75
-
76
-
77
-
78
-
79
-
80
-
81
-
82
-
83
-
84
-
85
-
86
-
87
-
88
-
89
-
90
-
91
-
92
-
93
-
94
-
95
-
96
-
97
-
98
-
99
-
100
-
101
-
102
-
103
-
104
-
105
-
106
-
107
-
108
-
109
-
110
-
111
-
112
-
113
-
114
-
115
-
116
-
117
-
118
-
119
-
120
-
121
-
122
-
123
-
124
-
125
-
126
-
127
-
128
-
129
-
130
-
131
-
132
-
133
-
134
-
135
-
136
-
137
-
138
-
139
-
140
-
141
-
142
-
143
-
144
-
145
-
146
-
147
-
148
-
149
-
150
-
151
-
152
-
153
-
154
-
155
-
156
-
157
-
158
-
159
-
160
-
161
-
162
-
163
-
164
-
165
-
166
-
167
-
168
-
169
-
170
-
171
-
172
-
173
-
174
-
175
-
176
-
177
-
178
-
179
-
180
-
181
-
182
-
183
-
184
-
185
-
186
-
187
-
188
-
189
-
190
-
191
-
192
-
193
-
194
-
195
-
196
-
197
-
198
-
199
-
200
-
201
-
202
-
 203
203 -
 204
204 -
 205
205 -
 206
206 -
 207
207 -
 208
208 -
 209
209 -
 210
210 -
 211
211 -
 212
212 -
 213
213 -
 214
214 -
 215
215 -
 216
216 -
 217
217 -
 218
218 -
 219
219 -
 220
220 -
 221
221 -
 222
222 -
 223
223 -
224
-
225
-
226
-
227
-
228
-
229
-
230
-
231
-
232
-
233
-
234
-
235
-
236
-
237
-
238
-
239
-
240
-
241
-
242
-
243
-
244
-
245
-
246
-
247
-
248
-
249
-
250
-
251
-
252
-
253
-
254
-
255
-
256
-
257
-
258
-
259
-
260
-
261
-
262
-
263
-
264
-
265
-
266
-
267
-
268
-
269
-
270
-
271
-
272
-
273
-
274
-
275
-
276
-
277
-
278
-
279
-
280
-
281
-
282
-
283
-
284
-
285
-
286
-
287
-
288
-
289
-
290
-
291
-
292
-
293
-
294
-
295
-
296
-
297
-
298
-
299
-
300
-
301
-
302
-
303
-
304
-
305
-
306
-
307
-
308
 |
 |

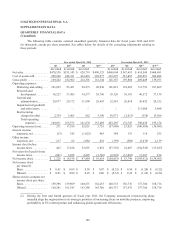
(2) Impairment of goodwill and other assets during the third quarter of fiscal year 2013 was due to an estimated
$211.0 million goodwill impairment charge related to the video conferencing reporting unit.
(3) Impairment of goodwill and other assets during the fourth quarter of fiscal year 2013 was due to an additional
$3.5 million in goodwill impairment charge related to the video conferencing reporting unit and $2.2 million
in impairment charges related to the digital video security product line.
(4) Basic and diluted earnings per share are computed independently for each of the quarters presented. Therefore,
the sum of quarterly basic and diluted per share information may not equal annual basic and diluted earnings
per share.
(5) During the quarter ended September 30, 2013, the Company implemented a restructuring plan solely affecting
the video conferencing operating segment to align its organization to its strategic priorities of increasing focus
on a tighter range of products, expanding cloud-based video conferencing services and improving profitability.
(6) The Company incurred $5.4 million of restructuring charges related to lease exit costs which pertains to
the consolidation our Silicon Valley campus from two buildings down to one during the quarter ended
March 31, 2014.
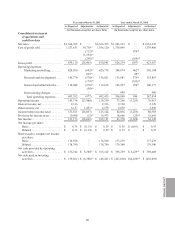
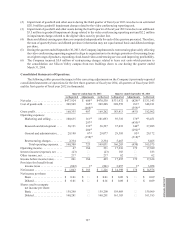
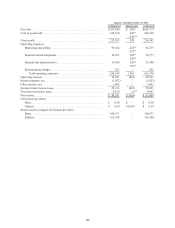
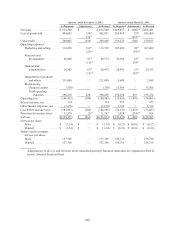
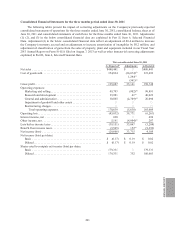
Consolidated Statements of Operations.
The following tables present the impact of the correcting adjustments on the Company’s previously-reported
consolidated statements of operations for the first three quarters of fiscal year 2014, all quarters of fiscal year 2013
and the first quarter of fiscal year 2012 (in thousands):
Quarter ended June 30, 2013 Quarter ended September 30, 2013
As Reported Adjustments As Revised As Reported Adjustments As Revised
Net sales . . . . . . . . . . . . . . . . . . . . . $477,924 $ 606(4) $478,530 $ 531,972 $ (829)(4) $ 531,143
Cost of goods sold . . . . . . . . . . . . . . 309,569 165(2) 309,268 348,559 181(2) 348,181
(466)(4) (559)(4)
Gross profit . . . . . . . . . . . . . . . . . . . 168,355 907 169,262 183,413 (451) 182,962
Operating expenses:
Marketing and selling . . . . . . . . 100,635 161(2) 101,093 93,710 176(2) 93,451
297(4) (435)(4)
Research and development . . . . 36,191 132(2) 36,527 37,633 144(2) 37,485
204(4) (292)(4)
General and administrative . . . . 29,148 87(2) 29,077 29,395 95(2) 29,172
(158)(4) (318)(4)
Restructuring charges . . . . . . . . 2,334 — 2,334 5,465 — 5,465
Total operating expenses . . . 168,308 723 169,031 166,203 (630) 165,573
Operating income . . . . . . . . . . . . . . 47 184 231 17,210 179 17,389
Interest income (expense), net . . . . (23) — (23) 183 — 183
Other income, net . . . . . . . . . . . . . . 217 — 217 62 — 62
Income before income taxes . . . . . . 241 184 425 17,455 179 17,634
Provision for (benefit from)
income taxes . . . . . . . . . . . . . . . (802) 1(4) (801) 3,057 1(4) 3,058
Net income . . . . . . . . . . . . . . . . . . . $ 1,043 $ 183 $ 1,226 $ 14,398 $ 178 $ 14,576
Net income per share:
Basic . . . . . . . . . . . . . . . . . . . . . $ 0.01 $ — $ 0.01 $ 0.09 $ — $ 0.09
Diluted . . . . . . . . . . . . . . . . . . . . $ 0.01 $ — $ 0.01 $ 0.09 $ — $ 0.09
Shares used to compute
net income per share:
Basic . . . . . . . . . . . . . . . . . . . . . 159,298 — 159,298 159,969 — 159,969
Diluted . . . . . . . . . . . . . . . . . . . . 160,281 — 160,281 161,183 — 161,183
ANNUAl REPORT
197