Logitech 2014 Annual Report Download - page 218
Download and view the complete annual report
Please find page 218 of the 2014 Logitech annual report below. You can navigate through the pages in the report by either clicking on the pages listed below, or by using the keyword search tool below to find specific information within the annual report.-
 1
1 -
2
-
3
-
4
-
5
-
6
-
7
-
8
-
9
-
10
-
11
-
12
-
13
-
14
-
15
-
16
-
17
-
18
-
19
-
20
-
21
-
22
-
23
-
24
-
25
-
26
-
27
-
28
-
29
-
30
-
31
-
32
-
33
-
34
-
35
-
36
-
37
-
38
-
39
-
40
-
41
-
42
-
43
-
44
-
45
-
46
-
47
-
48
-
49
-
50
-
51
-
52
-
53
-
54
-
55
-
56
-
57
-
58
-
59
-
60
-
61
-
62
-
63
-
64
-
65
-
66
-
67
-
68
-
69
-
70
-
71
-
72
-
73
-
74
-
75
-
76
-
77
-
78
-
79
-
80
-
81
-
82
-
83
-
84
-
85
-
86
-
87
-
88
-
89
-
90
-
91
-
92
-
93
-
94
-
95
-
96
-
97
-
98
-
99
-
100
-
101
-
102
-
103
-
104
-
105
-
106
-
107
-
108
-
109
-
110
-
111
-
112
-
113
-
114
-
115
-
116
-
117
-
118
-
119
-
120
-
121
-
122
-
123
-
124
-
125
-
126
-
127
-
128
-
129
-
130
-
131
-
132
-
133
-
134
-
135
-
136
-
137
-
138
-
139
-
140
-
141
-
142
-
143
-
144
-
145
-
146
-
147
-
148
-
149
-
150
-
151
-
152
-
153
-
154
-
155
-
156
-
157
-
158
-
159
-
160
-
161
-
162
-
163
-
164
-
165
-
166
-
167
-
168
-
169
-
170
-
171
-
172
-
173
-
174
-
175
-
176
-
177
-
178
-
179
-
180
-
181
-
182
-
183
-
184
-
185
-
186
-
187
-
188
-
189
-
190
-
191
-
192
-
193
-
194
-
195
-
196
-
197
-
198
-
199
-
200
-
201
-
202
-
203
-
204
-
205
-
206
-
207
-
 208
208 -
 209
209 -
 210
210 -
 211
211 -
 212
212 -
 213
213 -
 214
214 -
 215
215 -
 216
216 -
 217
217 -
 218
218 -
 219
219 -
 220
220 -
 221
221 -
 222
222 -
 223
223 -
 224
224 -
 225
225 -
 226
226 -
 227
227 -
 228
228 -
229
-
230
-
231
-
232
-
233
-
234
-
235
-
236
-
237
-
238
-
239
-
240
-
241
-
242
-
243
-
244
-
245
-
246
-
247
-
248
-
249
-
250
-
251
-
252
-
253
-
254
-
255
-
256
-
257
-
258
-
259
-
260
-
261
-
262
-
263
-
264
-
265
-
266
-
267
-
268
-
269
-
270
-
271
-
272
-
273
-
274
-
275
-
276
-
277
-
278
-
279
-
280
-
281
-
282
-
283
-
284
-
285
-
286
-
287
-
288
-
289
-
290
-
291
-
292
-
293
-
294
-
295
-
296
-
297
-
298
-
299
-
300
-
301
-
302
-
303
-
304
-
305
-
306
-
307
-
308
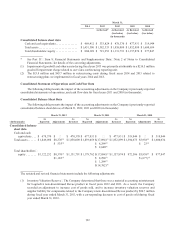
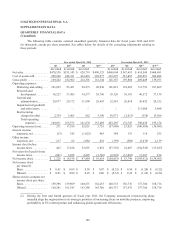
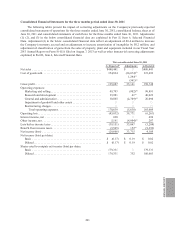
 |
 |

June 30, 2011
As Reported* Adjustments As Restated
ASSETS
Current assets:
Cash and cash equivalents . . . . . . . . . . . . . . . . . . . . . . . . . . . . . $ 476,367 $ — $ 476,367
Accounts receivable, net . . . . . . . . . . . . . . . . . . . . . . . . . . . . . . . 241,456 — 241,456
Inventories . . . . . . . . . . . . . . . . . . . . . . . . . . . . . . . . . . . . . . . . . . 317,548 3,044(1) 320,592
Other current assets . . . . . . . . . . . . . . . . . . . . . . . . . . . . . . . . . . 90,117 1,010(4) 91,127
Total current assets . . . . . . . . . . . . . . . . . . . . . . . . . . . . . . . . 1,125,488 4,054 1,129,542
Non-recurring assets:
Property, plant and equipment, net . . . . . . . . . . . . . . . . . . . . . . . 81,236 7,930(2) 89,166
Goodwill . . . . . . . . . . . . . . . . . . . . . . . . . . . . . . . . . . . . . . . . . . . 547,184 — 547,184
Other intangible assets . . . . . . . . . . . . . . . . . . . . . . . . . . . . . . . . 67,986 (1,046)(4) 66,940
Other assets . . . . . . . . . . . . . . . . . . . . . . . . . . . . . . . . . . . . . . . . . 71,183 (3,068)(4) 68,115
Total assets . . . . . . . . . . . . . . . . . . . . . . . . . . . . . . . . . . . . . . $ 1,893,077 $ 7,870 $1,900,947
LIABILITIES AND SHAREHOLDERS’ EQUITY
Current liabilities:
Accounts payable . . . . . . . . . . . . . . . . . . . . . . . . . . . . . . . . . . . . $ 328,305 (975)(4) 327,330
Accrued and other current liabilities . . . . . . . . . . . . . . . . . . . . . 189,374 11,642(4) 201,016
Total current liabilities . . . . . . . . . . . . . . . . . . . . . . . . . . . . . 517,679 10,667 528,346
Non-current liabilities . . . . . . . . . . . . . . . . . . . . . . . . . . . . . . . . . 189,059 11,850(4) 200,909
Total liabilities . . . . . . . . . . . . . . . . . . . . . . . . . . . . . . . . . . . . $ 706,738 $ 22,517 $ 729,255
Commitments and contingencies
Shareholders’ equity:
Registered shares, CHF 0.25 par value:
Issued and authorized shares—191,606 at
June 30, 2011 . . . . . . . . . . . . . . . . . . . . . . . . . . . . . . . . . . — — —
Conditionally authorized shares—50,000 at
June 30, 2011 . . . . . . . . . . . . . . . . . . . . . . . . . . . . . . . . . . $ 33,370 — 33,370
Additional paid-in capital . . . . . . . . . . . . . . . . . . . . . . . . . . . . . . 6,952 (3,472)(4) 3,480
Less: shares in treasury, at cost—12,236 at June 30, 2011. . . . . . . . (260,938) — (260,938)
Retained earnings . . . . . . . . . . . . . . . . . . . . . . . . . . . . . . . . . . . . 1,484,562 3,344(1) 1,473,916
7,930(2)
(21,920)(4)
Accumulated other comprehensive loss . . . . . . . . . . . . . . . . . . . (77,607) (529) (78,136)
Total shareholders’ equity . . . . . . . . . . . . . . . . . . . . . . . . . . . 1,186,339 (14,647) 1,171,692
Total liabilities and shareholders’ equity . . . . . . . . . . . . . . . $1,893,077 $ 7,870 $1,900,947
202